|
|
|
Abstract
This study theoretically and empirically analyzes the relationship between decentralization and welfare. The model identifies conditions in which a decentralized government is utility-maximizing compared to a centralized one. The empirical analysis utilized data from Philippine provinces to study the relationship between several decentralization indicators and welfare, as measured by per capita income, human development index, and poverty. Results suggest that fiscal independence, or the ability of local governments to generate their own revenues to finance their own expenditures rather than relying on central government transfers, is positively associated with per capita income and HDI. Moreover, this relationship is stronger when governance is better and weaker among lower-income provinces. In contrast, a higher number of local government units per population is linked to adverse development outcomes, and this association is stronger among lower-income provinces and weaker among those with good governance.
Keywords: decentralization; welfare; fiscal independence; Philippines
JEL: H70; H77; I30
1 Introduction and objectives
Decentralization is one of the most common fiscal reforms among low and middle-income economies (Smoke,  2005; Rodriguez-Pose and Gill, 2003; Bahl, 1999). The economic rationale behind decentralization is that in view of the proximity involved, local governments have an information advantage over the central government with respect to the preferences and needs of the consumers (Shah, 1998; Wallis and Oates, 1988; Wetzel, 2001). It has also been suggested that decentralization can help improve accountability and governance. By bringing the user and the provider of public goods nearer to each other, consumers can better check the performance of the government in the provision of public services (Faguet, 2009; Von Braun and Grote, 2002; Usui, 2007). Governance and efficiency can also improve when decentralized local governments compete with each other (Rodriguez-Pose, Tijmstra and Bwire, 2009). 2005; Rodriguez-Pose and Gill, 2003; Bahl, 1999). The economic rationale behind decentralization is that in view of the proximity involved, local governments have an information advantage over the central government with respect to the preferences and needs of the consumers (Shah, 1998; Wallis and Oates, 1988; Wetzel, 2001). It has also been suggested that decentralization can help improve accountability and governance. By bringing the user and the provider of public goods nearer to each other, consumers can better check the performance of the government in the provision of public services (Faguet, 2009; Von Braun and Grote, 2002; Usui, 2007). Governance and efficiency can also improve when decentralized local governments compete with each other (Rodriguez-Pose, Tijmstra and Bwire, 2009).
The primary disadvantage of decentralization is that the central government has economies of scale. Usually, it also has better access to resources and technology (Bahl, 1999; Faguet, 2004; Prud’homme, 1995). This means that the central government can provide public services at a lower per unit cost. Aside from the production- side efficiency of the central government, decentralization can also affect fiscal stability. If funds and revenues are decentralized, the central government has less access to funds and spending instruments. This can affect its fiscal position and ability to implement fiscal policy (Prud’homme, 1995). Decentralization can also exacerbate inequality (Bahl, 1999; Prud’homme, 1995) and further empower local officials (Faguet, 2009; Boone, 2003), who are likely to be more corrupt than those in the central government (Prud’homme, 1995).
These contrasting effects make decentralization a highly debated policy. The primary objective of this paper is to study the relationship between decentralization and welfare. It has a two-fold approach. The first is the employment of a set of models that attempt to identify conditions that make decentralization preferable over a centralized government setup from a utility-maximizing perspective. The second is an empirical analysis using the case of the Philippines. It tests for the relationship between several indicators of decentralization and some welfare measures. It also tests if the decentralization-welfare relationship varies across governance quality and income.
This paper makes several contributions to the literature. For one, the model has improved on some of the often-cited theoretical models on decentralization. It has tried to address some of the limitations of these existing models; and incorporated the role of governance. Some studies argue that governance is important in making decentralization effective for development (Bardhan, 2002; World Bank, 2009). Next, while empirical decentralization literature is common, most of it has studied the relationship of decentralization with economic growth or quality of governance. There are limited empirical studies on how decentralization is associated with actual welfare indicators, such as income, poverty, and the human development index. In addition, the case of the Philippines is important because it is one of the largest developing countries to have implemented a decentralization program in the past few decades. Although the empirical section did not look at the effects of this specific decentralization law, a quantitative empirical study of the effects of decentralization using Philippine data is warranted and new (Llanto, 2009).
This paper is organized as follows. These introduction and objectives are followed by the presentation of the models, and then by the empirical analysis. The paper ends with a summary and conclusion.
2 The model
2.1 Theoretical and conceptual background
Before the model is presented, some of the conceptual and theoretical links between decentralization and welfare will be discussed. These arguments suggest that decentralization and welfare can have either a positive or a negative relationship; which of these effects dominates should be determined empirically. Some studies argue that the relationship is positive under certain conditions.
There are two primary channels through which decentralization enhances welfare: (a) better delivery of public goods and services due to the information advantage of local governments, and (b) better provision of public goods and services from improvements in governance and accountability. The information advantage arises from the relative proximity of the people to the local government, allowing the latter to tailor public services to a group of people that is more homogenous and has similar preferences (Boadway and Shah, 2009; Kubal, 2006; Tanzi, 1996; Wallis and Oates, 1988).
For the second channel, decentralization can promote good governance and improve government responsiveness by enhancing accountability and by increasing citizen participation (Faguet, 2009; Kubal, 2006; Von Braun and Grote, 2002; Persson and Tabellini, 2000). Accountability is enhanced because the users of public services are closer to the government agency responsible and accountable for their provision (Usui, 2007). Accountability and governance can also improve under decentralization because of inter-jurisdictional competition, according to the seminal work of Tiebout ( 1956).
On the other hand, decentralization can also affect welfare adversely. First, the central government usually has superior ability to produce public services because they have better access to resources. They can also produce these services at a lower per unit cost because of economies of scale and economies of scope (Bahl, 1999; Faguet, 2004; Prud’homme, 1995).
Another disadvantage of decentralization is it has the potential to increase inequality (Bahl, 1999; Prud’homme, 1995; Qiao, Martinez-Vasquez and Xu, 2008). When localities have different levels of development and local governments have different capacities to raise revenues and to provide services, transferring more responsibilities to the sub-national governments can exacerbate inequality.
Decentralization can also risk macroeconomic stability. If government is decentralized, the central government has access to fewer revenues, and this limits its power to implement fiscal policy and other stabilizing policies (Prud’homme, 1995).
Decentralization also increases the likelihood of local elite capture and risks further empowerment of already powerful local officials (Faguet, 2009; Asante and Ayee, 2007; Boone, 2003). Prud’homme ( 1995) argues that corruption is generally more widespread in local than in central government.
Some studies argue that decentralization can be effective in promoting welfare, but only under certain conditions, with good governance, accountability, and quality of institutions as the most often cited intervening factors (Bardhan, 2002; Agrawal and Ribot, 1999; Jutting et al., 2005; Kim, 2018). Good governance and institutions are important because they limit the leakages from corruption and bureaucracy; they also provide checks and balances among local government officials. Accountability is equally important because it provides incentives to deliver public services effectively and imposes disincentives for inefficiency.
Economic conditions can also affect the effectiveness of decentralization. Bahl ( 1999) argues that developing countries possess conditions that limit the effectiveness of decentralization as a development tool. In addition, implementing a decentralization program entails costs – and for low-income countries, the opportunity cost may be too high if other poverty-alleviation programs are affected (Jutting et al., 2005).
Some of these arguments are often the starting point of formal decentralization theories. One of the earliest seminal theories was Oates’ ( 1972) “Decentralization Theorem”. Oates argued that decentralization allows local governments to tailor public goods to suit local preferences, making it welfare-enhancing. This theory was built from early public finance literature, notably from the works of Arrow ( 1970), Musgrave ( 1959), Samuelson ( 1954; 1955), and Oates ( 2005). Another often-cited early theory that explained the benefits of decentralization was Tiebout’s ( 1956) “voting with the feet” concept. If there is perfect mobility, consumers can choose the jurisdiction that offers their most preferred public goods.
The central ideas of these early theories are embodied even in more recent decentralization models. Xie, Zou and Davoodi ( 1999), and Davoodi and Zou ( 1998) modelled an optimal decentralization level from a growth and utility maximizing perspective. Relatedly, Faguet’s ( 2004) model attempted to determine conditions wherein a decentralized government will provide consumers with higher utility compared to a centralized setup. One primary difference between these models is that Xie et al. and Davoodi and Zou’s optimization is at the production side, i.e. they derived a decentralization level that maximizes growth (although the original objective function is to maximize utility from a single good). On the other hand, Faguet considered primarily the demand side – it maximized the net benefit from public goods. It then calculated the utility with and without decentralization and identified the condition in which decentralization produces the greater utility.
The Davoodi and Zou and Faguet models have some limitations. The former considered only the production side and not the demand side allocation of goods; and it assumed only one consumption good. The latter considered two consumption goods – private and public – but it did not incorporate the trade-off in producing these two types of goods. Moreover, it did not consider the allocative efficiency of the private and public good based on the consumer’s preference; that is, it only maximized the net benefit of the public good, but it did not consider the private good in utility maximization.
Following Faguet ( 2004), the model presented here uses a quasi-linear utility function where the numeraire is the private good. The difference is that the function for the utility from the public good was parameterized to reflect the usual assumption of the utility increasing at a decreasing rate. The utility of the representative consumer, i, is | Ui = Xi + θigβ, where 0 < β < 1 | (1) |
Faguet called θi the preference of i for the public good g. The variable β determines the contribution of the public good to utility and the marginal utility of the public good. As will be discussed later, there are two cases – a decentralized and a centralized government setup. This model will likewise incorporate the benefit of decentralization, which is better information on the preferences and needs of the consumers; and its disadvantage, which is the higher cost of producing public goods and services.
The model has three versions. The first is static, wherein the economy has a fixed output. Resources are allocated between the production of private and public goods while maximizing the representative consumer’s utility function, subject to the cost of producing each good and to the fixed income. The second follows Davoodi and Zou ( 1998) in that it is dynamic. Here, resources are allocated between producing the consumption goods and accumulating capital. Moreover, the income is not fixed – it is a function of private and public capital. The third version incorporates quality of governance in the model.
2.2 The basic (static) model
The utility function of the representative consumer differs between the decentralized and the centralized government setups. The utility function for the decentralized setup follows that in (1). In a centralized government, the benefit of decentralization is reflected by altering the utility function (1) into| Ui = Xi + (1 – ω)θigβ, where 0 < β, ω < 1 | (2) |
The utility of the representative consumer is maximized subject to the constraint where M is the fixed output of the economy and P is the price of producing the public good g, expressed in terms of the foregone production of the private good X. The price of the private good is thus normalized to one.
Like the utility function, the constraint differs between the centralized and the decentralized government setups. Following the argument that the disadvantage of decentralization is that the central government can produce public services more efficiently due to economies of scale and availability of better technologies and inputs, the constraint equation (3) is modified for the centralized setup into | M = X + (1 – σ)Pg, , where 0 < σ < 1 | (4) |
The variable σ represents this cost advantage of the central government over the local governments. It measures how much lower the central government can produce public goods compared to local governments. A higher value of σ means a larger difference in cost efficiency between the central and the local government.
The objective function and the constraint for the decentralized and the centralized setups are summarized in table 1. Under the decentralized government setup, the utility function (1) is maximized subject to the constraint (3). Under the centralized setup, the utility function (2) is maximized subject to the constraint (4).
Table 1Summary of utility functions and constraints DISPLAY Table
The solution to this optimization problem is a set of values of X and g, denoted as XC* and gC* for the centralized case and XD* and gD* for the decentralized case, expressed as a function of the parameters. For the centralized government setup, these are 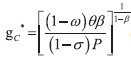 | (5) |
and 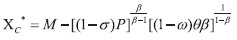 | (6) |
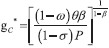
The optimized utility function under the centralized setup ( UC*) is then 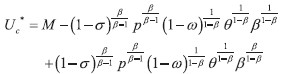 | (7) |
For the decentralized setup, the solutions are  | (8) |
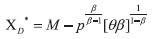 | (9) |
The optimized utility function under the decentralized setup ( UD*) is then 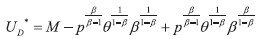 | (10) |
From a utility-maximizing perspective, decentralization is preferred over a centralized setup if UD* > UC*. This condition is met if This is more formally stated through Proposition 1.
Proposition 1: If the utility function of the representative consumer under a centralized and a decentralized government setup follows (2) and (1), respectively; and the constraint equation under a centralized and a decentralized government setup follows (4) and (3), respectively, then UD* > UC* if ω > 1 – (1 – σ)β.
Proof: The proof of proposition 1 follows the derivation above. Compute first for the optimal values of X and g for both the decentralized and centralized cases; then substitute them to equations (1) and (2) to compute for UD* and UC*. Then simplify the inequality UD* > UC*. Then simplify the inequality UD* > UC*. Q.E.D.
This result is similar to that of Faguet’s ( 2004) model, but with one important difference. In the Faguet model, the only condition for decentralization to be preferred over a centralized setup is for the information advantage of the local government to outweigh the cost advantage of the central government. In this model, it also must adjust for how much utility the consumer gains from the public good. The variable β is a measure of how much public goods contribute to the consumer’s utility or welfare. The higher the value of β, the higher the marginal utility of the public good.
In equation (11), there are two factors that determine the cut-off level of ω, above which a decentralized setup is preferred. One factor is σ, or the cost advantage of the central government. The higher the cost advantage of the central government (σ) is, the higher the information advantage of the local government (ω) must be. The other factor is β. When the public good has a relatively large contribution to the consumer’s utility (β), the information advantage of the local government (ω) should be larger for decentralization to be preferable.
For example, suppose that the only public good that the government provides is hospital services. Since the local government has an information advantage on consumer needs and preferences, it knows what diseases are prevalent in the locality and what medical services are needed most. Thus, it can tailor the hospitals to provide these services. However, the central government has economies of scale in hospital management, has better access to advanced medical technologies, and can hire better doctors. Thus, we can expect that σ is relatively high. The central government can provide the same service at a lower per unit cost. Moreover, because health services are crucial and is a basic human need, we expect β to be high. Therefore, for decentralization to be preferable over a centralized setup, the information advantage of the local government (ω) should be much higher (than in the case where σ and β are lower).
Compare this to the case when the only public good provided by the government is, say, public parks. Surely, the central government cannot have that much of a cost advantage over the local government in producing parks. In addition, additional units of parks are not likely to increase consumer utility by much. Thus, it is expected that σ and β are relatively low. Therefore, the utility effect of the local government’s information advantage need not be that large for decentralization to be preferable over a centralized government.
Note that the hospital and park examples were only given to intuitively illustrate the role of ω, σ, and β in determining whether a decentralized government is utility-maximizing compared to a centralized one. Public goods, in reality, are composed of a basket of goods and services; and ω, σ, and β are aggregated for the entire basket. The interpretation of equation (11) should be applied to the entire basket of public goods.
Equation (11) can also be interpreted in another way. A higher value of ω makes it more likely that equation (11) will be satisfied, while a higher value of σ makes it less likely. This implies that the higher the utility effect of the local government’s information advantage, the more likely it is that decentralization is utility-maximizing. On the other hand, the higher the cost advantage of the central government in producing public goods, the more likely it is that a centralized government setup will be utility-maximizing.
2.3 The dynamic model
This version has two fundamental differences from the static model. First, the output of the economy is no longer constant, but is a function of private capital, k, and public capital, f; and it takes a Cobb-Douglas form. Next, it is dynamic in that there is capital accumulation of both private and public capital and the utility being maximized is intertemporal, as in Davoodi and Zou (1998).
Thus, the utility functions for the centralized and decentralized government setup, respectively, are  | (13) |
The constraints under centralized and decentralized government setups, respectively, are 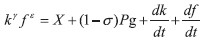 | (14) |
and  | (15) |
where 0 < γ, ε, σ < 1 ; γ + ε < 1
The left-hand side of the constraint equations is the economy’s production function. Under a centralized setup, the utility function in equation (12) is maximized subject to the constraint in equation (14). Under decentralization, (13) is maximized subject to (15).
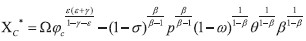
For both the centralized and decentralized government setups, the solution to the optimization problem is a set of values of X and g expressed as a function of parameters, denoted as XC*, gC*, XD*, and gD*. At steady state, for the centralized setup, these are 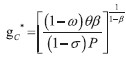 | (16) |
and 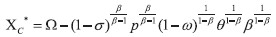 | (17) |
where 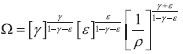 |
|
And for the decentralized setup, the solutions are  | (18) |
and 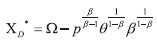 | (19) |
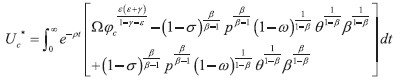
The optimized utility function can then be computed from the optimized values of the private and public goods. The maximized utility functions for the centralized and decentralized setups, denoted as UC* and UD* respectively, are 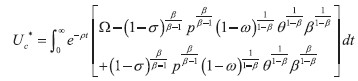 | (20) |
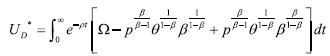 | (21) |
From a welfare point of view, a decentralized government setup is preferred to a centralized one if UD* > UC*. Like the static case, this condition is met when This is more formally stated through Proposition 2.
Proposition 2: If the utility function of the representative consumer under a centralized and a decentralized government setup follows (12) and (13), respectively; and the constraint equation under a centralized and a decentralized government setup follows (14) and (15), respectively, then, at steady state, UD* > UC* if ω > 1 – (1 – σ)β.
Proof: The proof of proposition 2 follows the derivation above. Compute first for the optimal values of X and g under steady state for both the centralized and decentralized cases; then substitute them to equations (12) and (13) to compute for UC* and UD*. Then simplify the inequality UD* > UC*. Q.E.D.
Note that the optimal values of private and public capital in both the decentralized and centralized case (kD*, fD*, kC*, fC*) can also be computed, although they are not needed in determining UD* and UC* because utility is a function of consumption goods. These are:
In addition, the welfare loss of adopting the wrong (de)centralization policy can also be computed. When UD* > UC*, the welfare maximizing policy is to decentralize the government; and welfare loss from centralization is 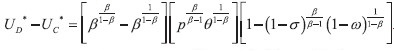 ![]() ![]() . On the other hand, when UC* > UD*, the welfare maximizing policy is to centralize the government; and welfare loss from decentralization is UC* - UD* =  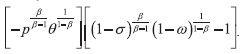 . The same computation can also be applied to the static model.
2.4 The dynamic model with governance quality
This version of the model incorporates the role of governance in the decentralization welfare relationship. It considers the difference in quality of governance between the central and the local governments. Here, governance quality is measured by how much of the available public capital, f, is actually used in production. The utility functions remain the same as in the dynamic model. However, the constraints under centralized and decentralized government setups, respectively, become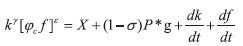 | (23) |
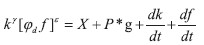 | (24) |
where 0 < γ,ε,σ < 1 ; γ + ε < 1.
The variables φc and φd measure the governance quality of the central and local governments, respectively. They measure how much of the available public capital is actually used in production, as some of it is wasted because of poor governance, corruption, and other inefficiencies. The higher the value of φ, the higher the amount of public capital that goes to production and the better the governance quality. The lower the value of φ, the higher the inefficiency and the poorer the quality of governance.
Following the same optimization process, the optimized values of g and X at steady state under a centralized government setup are
 | (25)
|
and
 |
(26) |
Under a decentralized setup, the optimized values 1 of g and X are
 | (27) |
and 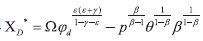 | (28) |
The maximized utility under a centralized and a decentralized government setup, respectively, are
 | (29) |
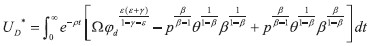 | (30) |
As before, a decentralized government setup is preferred from a welfare point of view if UD* > UC*, and the condition for meeting this is
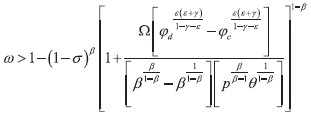 | (31) |
This is more formally stated through Proposition 3.
Proposition 3: If the utility function of the representative consumer under a centralized and a decentralized government setup follows (12) and (13), respectively; and the constraint equation under a centralized and a decentralized government setup follows (23) and (24), respectively, then, at steady state, UD* > UC* if (31) holds.
The proof of Proposition 3 is similar to that of Proposition 2. Equation (31) is similar to (11) and (22), except that the last term of the right-hand side is multiplied by a set of constants, which include the measures of governance quality for local and central governments (φd and φc). For ease of interpretation, let
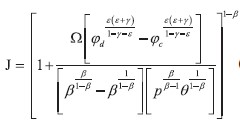 | (32) |
 | (33)
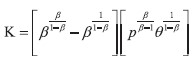
|
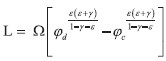 | (34) |
Thus,
 | (35) |
and equation (31) can be modified into Equations (31) and (36) show the effect of governance quality on the condition in which decentralization is utility-maximizing. Note that K and Ω are always greater than zero (as long as β is assumed to be < 1), while the sign of L depends on whether φd > φc or φc > φd. If , φc > φd the central government has better governance quality than the local governments. If , φd > φc the opposite is true.
Take the case wherein φd > φc. Here, L is positive, and thus, J >1. The second term in the right-hand side of (36) will therefore increase (compared to the model where there is no governance); and the required ω for (36) to hold will decrease. Alternatively, in the same case where φd > φc, and ω remains constant, σ would have to be higher (compared to the case where there is no governance) for (36) to hold. Intuitively, if the local government has better governance than the central government, then for decentralization to be welfare-maximizing, (1) the utility effect of the local government’s information advantage need not be that high, or (2) the central government’s cost advantage must be much higher. That is, if the local governments have better governance than the central government, it makes sense to decentralize even if the former’s information advantage is not that much. Alternatively, it makes sense to decentralize even if the latter’s cost advantage is much higher.
Now, for the case in which φc > φd. Here, L is negative. If it will be assumed that / L/ < / K/, 2 then 0 < J < 1. The second term in the right-hand side of (36) will therefore decrease (compared to the model where there is no governance and compared to the case where φd > φc); and the required ω for equation (36) to hold will increase. Alternatively, if ω remains constant, σ would have to be lower for equation (36) to hold. Intuitively, if the central government has better governance than the local government, then for decentralization to be welfare-maximizing, the utility effect of the local government’s information advantage should be much higher or the central government’s cost advantage need not be that high. That is, if the central government has better governance than the local governments, it would only make sense to decentralize if the latter’s information advantage is much higher. Alternatively, it would make sense to centralize even if the former’s cost advantage is not that much.
The effect of σ remains the same. The higher the cost advantage of the central government in providing public goods ( σ), the higher the information advantage of the local government should be for decentralization to be preferred. 3
2.5 Summary of results from the models
The results imply that decentralization is utility-maximizing compared to a centralized government under certain conditions. The key variables are: the additional utility from local public goods brought about by the information advantage of the local government, the cost advantage of the central government, the contribution of the public good to the consumer’s utility, and the difference in governance quality between the local and the central government.
The higher the additional utility from local public goods brought about by the local government’s information advantage and the lower the cost advantage of the central government, the greater the case for decentralization. In addition, better governance for the central government is a case for centralization while better governance for the local governments is a case for decentralization. Whether decentralization is preferred from a utility-maximizing perspective depends on the relative values of these variables.
3 Empirical analysis
The empirical analysis utilized data from Philippine provinces. Accordingly, a background on the local government structure of the Philippines will be briefly discussed first. The highest level of sub-national government in the Philippines is the province, with the country being composed of 81 such local government units (80 during the time period covered by this study). Provinces are composed of cities and municipalities – with the former being more populous, larger in area, earning higher incomes, and having greater autonomy. There are almost 1,500 municipalities and almost 150 cities in the Philippines. All municipalities and a great majority of cities are politically and administratively under the supervision of a province. A small number of cities are politically independent from a province, most of them in the Metro Manila area – an agglomeration of cities surrounding the national capital.
The smallest political unit with a local government is the barangay, and there are more than 42,000 of these in the country. Cities and municipalities are divided into these barangays. The barangay government, however, has very little power, limited to such matters as settling minor disputes and conducting community programs.
3.1 Linkages between the model and the empirics
Before proceeding, it must be made clear that this section is not a direct empirical test of the model. A direct empirical test would be difficult given the available dana and given that the primary model results are conditions that make decentralization preferable to a centralized government. However, the theoretical model is linked to the empirical section in several ways. In particular, the model results regarding governance can be supported empirically.
The first link between the model and the empirical section is the governance variable. The model says that the difference in the governance quality between the local and the central government affects the likelihood of decentralization being welfare-enhancing or not. If local governments have better governance, decentralization is more likely to be welfare-enhancing; if governance in the central government is better, then decentralization may lead to adverse welfare effects. In the empirical section, governance quality is interacted with the decentralization variables to see if it enhances any positive effect of decentralization or if it moderates any adverse impact of decentralization. This is an important contribution to the literature because some research argues that good governance is an important factor in making decentralization effective (Bardhan, 2002; World Bank, 2009).
Another link is the control variables used in the regressions. Private capital can be argued to be proxied by the control variable bank deposits and public capital by provincial government revenue per capita. The dependent variables used in the regression analyses also link the models with the empirics. The model looks at conditions that make decentralization welfare- or utility-enhancing; and the regression analysis looks at the relationship between three indicators of welfare and decentralization.
3.2 Measuring decentralization and welfare
Using an appropriate decentralization measure is a challenge in any empirical decentralization study, and this is more pronounced in country-specific papers. Comparing decentralization across countries is more direct and straightforward, using such indicators as proportion of local government to total government spending (Gemmell, Kneller and Sanz, 2013; Rodriguez-Pose and Ezcurra, 2011), proportion of local government to total government revenue (Bodman, 2010; Woller and Phillips, 1998), number of local government units (Bodman, 2010; Arikan, 2004), and even the extent to which the government uses the internet to deliver public services (called virtual decentralization (Goel and Saunoris, 2016)). In contrast, comparing decentralization across territories from the same country (e.g. states, provinces, regions, cities, etc.) is more difficult. The reason is that states, provinces, and cities are subjected to the same national or federal laws. The difficulty is more pronounced in countries where there is not much variation in local laws and sub-national governments have little power.
Nonetheless, country-specific decentralization studies have used various indicators. Three indicators of decentralization at the provincial level were used for this analysis. The first is an indicator of fiscal independence, similar to that used by Akai and Sakata ( 2002). The other two measure how fragmented the province is in terms of local governance, akin to Hammond and Tosun ( 2011), Stansel ( 2005), and Tosun and Yilmaz ( 2008). The fiscal independence indicator is own-sourced revenues of the provincial government expressed as share of total expenditure of the provincial government ( fiscal_indep) 4. This variable measures the independence of the provincial government from the central government in funding its expenditures. It measures the local government’s ability to generate its own revenue to fund its functions 5.
Fiscal independence is an important component of fiscal decentralization. Akai and Sakata ( 2002) argue that even if expenditure shares of the sub-national governments are small relative to total government spending, the local government is still independent if its spending needs can be financed from within. There are several reasons for using this indicator as a measure of decentralization. First, it measures revenue independence of the provincial government from the national government. When locally sourced revenues account for a larger share of total revenues and expenditures, provincial governments do not need to depend as much on the national government for funds. Second, there are local government units – usually the low-income municipalities or even provinces – that are heavily dependent on revenue share transfers from the national government, formally known in the Philippines as the Internal Revenue Allotment (IRA). This means that although there are functions assigned to these local governments, they still rely heavily on national government transfers to fund these functions.
Third, having more locally sourced revenue means provincial governments can implement more of their own programs, reducing their dependence on national government programs for their constituents. Manasan ( 1997) and Capuno ( 2017) argue that after the 1991 decentralization law, some local governments had a hard time performing the devolved functions because the additional fiscal revenues did not match the additional responsibilities. If a local government can generate its own revenue source, not only does it not have to rely as much on the national government for revenues, it can also finance its functions better and even implement additional programs.
The final two decentralization indicators are the number of local government units (cities and municipalities) in the province per 100 thousand population ( decent_popn) and the number of local government units in the province per one thousand square kilometers of land area ( decent_area). A province is more decentralized if each local government unit governs fewer people. The fewer constituents and the more homogenous preferences that come with it can complement the local government’s information advantage with respect to the needs and preferences of the consumers. This can allow local governments to provide locally suited public goods and services. On the other hand, too much decentralization can lead to fragmented and incomplete public service provision (Wetzel, 2001; Capuno, 2017) and high per unit cost due to the absence of economies of scale.
This study used three indicators of welfare – poverty incidence, per capita income, and the human development index (HDI). The poverty indicator is the percentage of population below the poverty line (poverty), based on the provincial-level poverty estimates of the Philippine Statistical Authority made available every three years. The provincial per capita income is expressed in constant 2012 Philippine pesos (PhP) with purchasing power parity based in Metro Manila prices (income). This variable and the provincial HDI (hdi) are from the triannual (once every three years) Philippine Human Development Report, available in the same years as the poverty incidence report.
These indicators represent various kinds or levels of welfare. Using different outcome variables not only act as robustness check, it can also provide insights on how decentralization affects welfare. For instance, if this study finds a positive relationship between decentralization and per capita income, and a similar positive association between decentralization and poverty, it could suggest that decentralization positively affects average welfare but negatively influences those at the bottom of the income range.
3.3 Estimation strategy
Equation (37) shows the general empirical model that tests for the relationship between decentralization and welfare. It is roughly based on the empirical specification of studies on determinants of poverty and living standards in the Philippines (e.g. Balisacan and Pernia, 2002; Balisacan and Fuwa, 200). | wit = a + β1*dit + β2*Xit + μit | (37) |
The control vector also contains several interaction terms. It includes an interaction between decentralization and the governance indicator, and between decentralization and a dummy for lower-income provinces 7. The former tests if governance affects the decentralization-welfare relationship; while the latter tests if the effect of decentralization on welfare, if any, is stronger or weaker in lower-income provinces. The summary statistics and the correlation table of all the variables used are reported in appendix tables A1 and A2.
The data on poverty, per capita income, and HDI are available every three years. This study made use of the 2006, 2009, and 2012 statistics. While data for earlier years were available, this period has the most complete set of available control variables.
On the other hand, the decentralization indicators and most control variables are available annually. The fiscal independence variable was generated using dana from the Bureau of Local Government Finance (BLGF), while the remaining two decentralization indicators were constructed using data from the Philippine Statistical Authority. To account for this timing difference in available data, the welfare indicators poverty, income, and hdi were matched with the annual average of the previous three years of the independent variables. For instance, the 2012 poverty, per capita income, and HDI data were matched with the 2010 to 2012 annual average of the independent variables; while the one for 2009 was matched with the 2007 to 2009 annual average. The GGI was available only for 2005 and 2008. Thus, GGI 2005 was matched with 2006 observations while GGI 2008 was matched with 2009 and 2012.
Equation (37) was estimated using ordinary least squares with heteroskedasticityrobust standard errors. To check for robustness, it was also estimated using cluster-robust standard errors, with clustering in regions. 8 It was estimated on a panel consisting of the 80 provinces of the Philippines and the three time periods discussed above. As a further robustness check, the control variables were varied to see if the results were affected. Eventually, only the significant controls were included in the regressions.
3.4 Results and discussions
The regression coefficients are presented in table 2. Columns 1 to 3 of table 2 show the results of regressing per capita income on the three decentralization variables. Columns 4 to 6 present the results for HDI, and columns 7 to 9 for poverty incidence. In each of these panels, the left-most column (columns 1, 4, and 7) shows the results without the interaction terms; the second column (columns 2, 5, and 8) includes the interaction terms between decentralization and governance; and the third column (columns 3, 6, and 9) includes the interaction terms between decentralization and dummy for lower-income provinces (lowinc).
Results suggest that the share of own-sourced revenue to expenditure (fiscal_indep), is positively associated with per capita income and with HDI. Using the coefficients in columns 1 to 3, a one percentage point increase in fiscal_indep is associated with PhP89.8 to PhP109.4 higher provincial per capita income. Similarly, using the coefficients in columns 4 to 6, a one percentage point increase in fiscal_indep is associated with 0.07 to 0.08 higher HDI.
The interaction terms involving fiscal independence also proved to be significant. The interaction between fiscal_indep and governance quality is positive and significant for both the per capita income and HDI runs. This suggests that the positive relationship between fiscal_indep and per capita income and between fiscal_indep and HDI is stronger in provinces with better governance and weaker in provinces with poorer governance. In addition, the interaction between fiscal_indep and the low-income province dummy was negative and significant in the per capita income regression. This suggests that the positive relationship between per capita income and fiscal independence is weaker among lower-income provinces.
In contrast to fiscal independence, the number of local governments per 100 thousand population (sng_popn) is negatively associated with both per capita income and HDI. An additional local government per 100 thousand people is associated with PhP292 to PhP855 lower per capita income and with 0.004 to 0.012 lower HDI. However, as in fiscal_indep, governance and the low-income dummy are intervening variables to the relationship between sng_popn and per capita income and HDI. For both the per capita income and HDI runs, the coefficient of the interaction term between sng_popn and governance is positive and significant, while the interaction between sng_popn and the low-income dummy is negative and significant. These suggest that the adverse effect of sng_popn on per capita income and on HDI is weaker among provinces with good governance; and stronger among lower-income provinces.
Unlike fiscal_indep and sng_popn, the number of local governments per 1,000 square kilometer land area (sng_area) is insignificant for all regressions involving per capita income and HDI. As mentioned in the footnotes of table 2, the results for per capita income and HDI are mostly robust to using cluster-robust standard errors and in adding a few more control variables.
Turning the discussion to the poverty regressions, the results are mostly consistent with those of per capita income and HDI. However, they are not as robust. As mentioned in the footnotes of table 2, about half of the significant decentralization indicators and their interaction terms lost significance when using cluster-robust standard errors or when a few more control variables were added. One should therefore be more careful in forming interpretations based on the poverty runs.
Fiscal independence, which is positively associated with per capita income and HDI, has no relationship with poverty. Its coefficients were negative in the poverty regressions, but none were significant. The number of local governments per 100 thousand population (sng_popn) was positive and significant in columns 7 to 9 of table 2. This is consistent with its negative and significant coefficients in columns 1 to 6. Moreover, the interaction between sng_popn and governance is negative and significant. This suggests that the adverse effect of sng_popn on poverty is weaker among provinces with good governance. The interaction between sng_popn and the low-income dummy is positive and significant, suggesting that the adverse effect of sng_popn on poverty is stronger among lower-income provinces.
An interesting result for poverty is the negative and significant coefficients of sng_area. This means that the number of local governments per population is associated with higher poverty, but the number of local governments per land area is associated with lower poverty. The significance of sng_area in the poverty regressions, however, disappears with additional controls. It also loses its significance in some poverty runs when cluster-robust SEs are used.
Nonetheless, what could be the reason for these contrasting results? A possible explanation is that too many local governments per population lead to fragmented delivery of public services (Wetzel, 2001). On the other hand, the presence of more local governments per area ensures that no locality is so remote that they are neglected because no public service provider reaches them.
As for the control variables, they have their expected signs. More years of schooling, better quality of governance, higher rate of urbanity, and greater bank deposits per capita are associated with higher per capita income and higher HDI. Moreover, more years of schooling, better quality of governance, and higher rate of urbanity, are associated with lower poverty.
Table 2Regression results DISPLAY Table
3.5 Discussions and implications
These empirical results suggest several implications on the relationship between decentralization and welfare. First, the relationship is mixed, depending on the form of decentralization and indicator of welfare. Fiscal independence – the ability of the local government to generate own-sourced revenues – appears to have a positive relationship with per capita income and with HDI. That is, provinces where the provincial government has greater ability to generate its own resources rather than relying on transfers from the central government have greater per capita income and higher HDI. Fiscal independence, however, has no significant relationship with poverty.
The importance of the local government’s ability to generate its own revenue for decentralization to be effective has been emphasized in the literature (Manasan, 1997; Capuno, 2017; Shen, Jin and Zou, 2012). With more revenue-generating capability, local governments need not rely too much on the national government to fund their spending requirements. Therefore, more funds are available readily, without having to go through the politics of inter-governmental fiscal transfers from the central to the local governments. In the Philippines, Hutchcroft ( 2012) argues, these transfers have become a tool for patronage politics among local politicians.
Second, in contrast to fiscal independence, a greater number of local governments per population is associated with lower welfare. A possible explanation for this is that too many local governments per population lead to fragmented delivery of public services (Wetzel, 2001). Too many local governments providing public services to too few people can cause a loss of efficiency and economies of scale. Capuno ( 2017) further argues that public service delivery is already fragmented with the current decentralization setup of the Philippine government. Adding more local governments per unit population can worsen this.
Third, the results suggest that governance plays an important intervening role in the relationship between decentralization and welfare. Good governance enhances the positive relationship between fiscal independence and per capita income and HDI. That is, the positive relationship of fiscal independence with per capita income and with HDI is stronger among provinces with better governance (and weaker among those that are poorly governed). Conversely, good governance moderates the negative relationship between sng_popn and welfare. That is, the negative relationship of sng_popn with per capita income and with HDI is weaker among provinces with good governance. This coheres with the literature saying that good governance is needed for decentralization to be effective (World Bank, 2009).
These results also provide empirical support to the model developed in this paper. One implication of the model is better governance in the local government increases the likelihood that decentralization will be welfare-maximizing; and better governance in the central government increases the likelihood that a centralized government setup is welfare-enhancing. This empirical result also supports the model’s finding that when decentralization is utility-maximizing, the difference between the utility under a decentralized government and the utility under a centralized setup is positively related to the quality of local governance (see footnote 3).
Fourth, income level also has an intervening role in the decentralization-welfare relationship. When the relationship between decentralization and welfare is positive – as in fiscal independence with per capita income and HDI – the relationship is weaker among lower income provinces. When the relationship between relationship and welfare is negative – as in sng_popn with per capita income and HDI – the relationship is even stronger among lower-income provinces. These results suggest that lower income provinces get the shorter end of the stick of decentralization, while richer provinces get most of the benefits.
Fifth, these empirical results could have some policy implications on decentralization as a development strategy. Fiscal independence could have a positive effect on average welfare (per capita income and HDI), but it cannot influence poverty reduction. Consequently, if fiscal independence positively affects per capita income but not poverty, and this effect is stronger on those with higher income to begin with, a possible unintended consequence of fiscal independence is worsening inequality.
Moreover, the positive relationship of welfare with fiscal independence and its negative relationship with fragmentation (number of local governments) suggest that decentralization can have varying effects depending on its form. In other words, decentralization can involve tradeoffs and its design is crucial in making it effective. Finally, another policy implication is that improving governance quality is an important factor in linking decentralization to welfare.
4 Summary and conclusion
This paper studies the relationship between decentralization and welfare using a theoretical and an empirical approach. Building on existing literature, this paper proposes three related models that analyze under what conditions decentralization is utility-maximizing compared to a centralized government setup. The main results show that decentralization being preferred over a centralized setup depends on several key variables – the utility effect of the local government’s information advantage, the cost advantage of the central government in producing public goods, the contribution of public goods to the consumer’s utility, and the difference in governance quality between the local and the central government.
The higher the additional utility from public goods brought about by the local government’s information advantage and the lower the cost advantage of the central government, the greater the case for decentralization. In addition, better governance for the central government is a case for centralization while better governance for the local governments is a case for decentralization. Whether decentralization is these variables.
The empirical analysis used data from Philippine provinces and studied the relationship between decentralization and welfare as measured by per capita income, HDI, and poverty incidence. Three decentralization measures at the provincial level were used – share of own-sourced revenues to total expenditures of the provincial government, number of local government units per population, and number of local government units per land area.
Results suggest that fiscal independence is positively associated with per capita income and with HDI. However, there are intervening variables in this relationship, particularly governance quality and income level. The positive relationship is stronger when governance is better and weaker among lower-income provinces. Fiscal independence has no relationship with poverty. In contrast, a greater number of local government units per population is associated with lower per capita income and lower HDI. This adverse relationship is weaker among provinces with good governance and stronger among lower-income provinces.
These results could have some policy implications on decentralization as a development strategy. If the positive relationship between fiscal independence and per capita income is observed more strongly among higher income provinces, and fiscal independence has no effect on poverty, then a possible unintended consequence is worsening inequality. Another policy implication is the importance of quality of governance in making decentralization effective. All these points suggest that decentralization could indeed have mixed effects, and its effectiveness depends on a proper policy mix along with proper institutional and economic environments.
Appendix
Table A1Summary statistics DISPLAY Table Table A2Correlation table DISPLAY Table
Notes
* The author thanks Alvin Ang, Fernando Aldaba, Rosalina Tan, Noel De Guzman, Agham Cuevas, Philip Arnold Tuaño, and Victor Venida for comments on an earlier version; and two anonymous referees whose comments helped to substantially improve this paper. All remaining errors are the author’s sole responsibility.
1 Like in the model without governance, the optimal values kD*, fD*, kC* and fC* can also be computed, although they are not needed in determining UD* and UC*. These are: 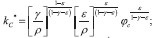 ; ; 
2 In the case where /L/ > /K/, the terms inside the bracket in equation (35) will be negative. Since it will be raised to a fraction (1-β), J could either be positive, negative, or imaginary.
3 Like in the model without governance, the welfare loss from adopting the wrong de/centralization policy can be computed. If the welfare maximizing policy is to decentralize, welfare loss from centralization is 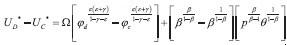  . If centralization is welfare maximizing, the welfare loss from decentralization is . If centralization is welfare maximizing, the welfare loss from decentralization is 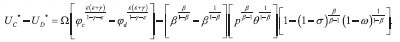 . .
4 A second indicator – own-sourced revenues of the provincial government expressed as share of total revenue of the provincial government – was considered. However, it was no longer used because it is highly correlated with fiscal_indep (correlation coefficient of 0.92).
5 It must be noted that the variable fiscal_indep was computed using own revenues and expenditures of the provincial government – and not the consolidated budget of provincial plus sub-provincial governments.
6 I thank one anonymous reviewer for suggesting the inclusion of this independent variable.
7 Dummy =1 if provincial per capita income is below the median; =0 otherwise.
8 The 80 Philippine provinces are grouped into 16 so-called regions. These regions are not local governments but are merely geographic groupings.
* The author thanks Alvin Ang, Fernando Aldaba, Rosalina Tan, Noel De Guzman, Agham Cuevas, Philip Arnold Tuaño, and Victor Venida for comments on an earlier version; and two anonymous referees whose comments helped to substantially improve this paper. All remaining errors are the author’s sole responsibility.
1 Like in the model without governance, the optimal values kD*, fD*, kC* and fC* can also be computed, although they are not needed in determining UD* and UC*. These are: ;
2 In the case where /L/ > /K/, the terms inside the bracket in equation (35) will be negative. Since it will be raised to a fraction (1- β), J could either be positive, negative, or imaginary.
3 Like in the model without governance, the welfare loss from adopting the wrong de/centralization policy can be computed. If the welfare maximizing policy is to decentralize, welfare loss from centralization is . If centralization is welfare maximizing, the welfare loss from decentralization is .
4 A second indicator – own-sourced revenues of the provincial government expressed as share of total revenue of the provincial government – was considered. However, it was no longer used because it is highly correlated with fiscal_indep (correlation coefficient of 0.92).
5 It must be noted that the variable fiscal_indep was computed using own revenues and expenditures of the provincial government – and not the consolidated budget of provincial plus sub-provincial governments.
6 I thank one anonymous reviewer for suggesting the inclusion of this independent variable.
7 Dummy =1 if provincial per capita income is below the median; =0 otherwise.
8 The 80 Philippine provinces are grouped into 16 so-called regions. These regions are not local governments but are merely geographic groupings.
Disclosure statement
No potential conflict of interest was reported by the author.
References
Agrawal, A. and Ribot, J. C., 1999. Accountability in Decentralization: A Framework with South Asian and West African Cases. Journal of Developing Areas, 33(4), pp. 473-502.
Akai, N. and Sakata, M., 2002. Fiscal Decentralization Contributes to Economic Growth: Evidence from State-Level Cross-Section Data for the United States. Journal of Urban Economics, 52(1), pp. 93-108 [ CrossRef]
Arikan, G. G., 2004. Fiscal Decentralization: A Remedy for Corruption? International Tax and Public Finance, 11, pp. 175-195 [ CrossRef]
Asante, F. and Ayee, J., 2007. Decentralization and poverty reduction. In E. Aryeetey, ed. The Economy of Ghana: Analytical Perspectives on Stability, Growth, & Poverty. Woeli Publishing Services: Accra, pp. 325-347.
Bahl, R., 1999. Fiscal decentralization as development policy. Public Budgeting & Finance, 19(2), pp. 59-75 [ CrossRef]
Balisacan, A. and Fuwa, N., 2004. Going Beyond Cross-Country Averages: Growth, Inequality, and Poverty Reduction in the Philippines. World Development, 32(11), pp. 1891-1907 [ CrossRef]
Balisacan, A. and Pernia, E., 2002. Probing Beneath Cross-National Averages: Poverty, Inequality, and Growth in the Philippines. Asian Development Bank ERD Working Paper Series, No. 7.
Bardhan, P., 2002. Decentralization of Governance and Development. Journal of Economic Perspectives, 16(4), pp. 185-225 [ CrossRef]
Boadway, R. and Shah, A., 2009. Fiscal Federalism: Principles and Practices of Multiorder Governance. New York: Cambridge University Press [ CrossRef]
Bodman, P., 2010. Fiscal Decentralisation and Economic Growth in the OECD. Applied Economics, 43(23), pp. 3021-3035 [ CrossRef]
Boone, C., 2003. Decentralization as Political Strategy in West Africa. Comparative Political Studies, 36, pp. 355-380 [ CrossRef]
Davoodi, H. and Zou, H., 1998. Fiscal decentralization and economic growth: a cross-country study. Journal of Urban Economics, 43, pp. 244.257 [ CrossRef]
Faguet, J., 2004. Does decentralization increase government responsiveness to local needs? Evidence from Bolivia. Journal of Public Economics, 88, pp. 867-893 [ CrossRef]
Faguet, J., 2009. Governance from below in Bolivia: A theory of local government with two empirical tests. Latin American Politics and Society, 51, pp. 29-68 [ CrossRef]
Gemmell, N., Kneller, R. and Sanz, I., 2013. Fiscal Decentralization and Economic Growth: Spending versus Revenue Decentralization. Economic Inquiry, 51, pp. 1915-1931 [ CrossRef]
Goel, R. K. and Saunoris, J. W., 2016. Virtual Versus Physical Government Decentralization: Effects on Corruption and the Shadow Economy. Public Budgeting and Finance, 36, pp. 68-93 [ CrossRef]
Hammond, G. W. and Tosun, M. S., 2011. The Impact of Local Decentralization on Economic Growth: Evidence from U.S. Counties. Journal of Regional Science, 51, pp. 47-64 [ CrossRef]
Hutchcroft, P. D., 2012. Re-slicing the Pie of Patronage: The Politics of the Internal Revenue Allotment in the Philippines, 1991-2010. Philippine Reviewof Economics, 49, pp. 109-134.
Jutting, J. [et al.], 2005. What Makes Decentralisation in Developing Countries Pro-poor? E uropean Journal of Development Research, 17, pp. 626-648 [ CrossRef]
Kim, J., 2018. Fiscal decentralisation and inclusive growth: An overview. In: OECD Fiscal Federalism Studies: Fiscal Decentralisation and Inclusive Growth /J. Kim and S. Dougherty, eds, pp. 9-20. Paris: OECD Publishing and Seoul: Korea Institute of Public Finance [ CrossRef]
Kubal, M., 2006. Contradictions and constraints in Chile's health care and education decentralization. Latin American Politics and Society, 48, pp. 105-135 [ CrossRef]
Llanto, G., 2009. Fiscal decentralization and local finance reforms in the Philippines. Philippine Institute for Development Studies Discussion Paper Series, No. 2009-10.
Musgrave, R., 1959. The Theory of Public Finance. New York: McGraw-Hill.
Oates, W., 1972. Fiscal Federalism. New York: Harcourt Brace Jovanovich.
Oates, W., 2005. Toward a Second-Generation Theory of Fiscal Federalism. International Tax and Public Finance, 12, pp. 349-373 [ CrossRef]
Persson, T. and Tabellini, G., 2000. Political Economics: Explaining Economic Policy. Cambridge and London: Massachusetts Institute of Technology Press.
Prud’homme, R., 1995. The Dangers of Decentralization. The World Bank Research Observer, 10, pp. 201-220 [ CrossRef]
Qiao, B., Martinez-Vasquez, J. and Xu, Y., 2008. Growth and Equity Tradeoff in Decentralization Policy: China's Experience. Journal of Development Economics, 86, pp. 112-128 [ CrossRef]
Rodriguez-Pose, A. and Ezcurra, R., 2011. Is Fiscal Decentralization Harmful for Economic Growth? Evidence from the OECD countries. Journal of Economic Geography, 11, pp. 619-643 [ CrossRef]
Rodriguez-Pose, A. and Gill, N., 2003. The Global Trend Towards Devolution and Its Implications. Environment and Planning C: Government and Policy, 21, pp. 333-351 [ CrossRef]
Rodriguez-Pose, A., Tijmstra, S. A. R. and Bwire, A., 2009. Fiscal Decentralisation, Efficiency, and Growth. Environment and Planning A: Economy and Space, 41, pp. 2041-2062 [ CrossRef]
Samuelson, P., 1954. The Pure Theory of Public Expenditure. Review of Economics and Statistics, 36, pp. 387-389 [ CrossRef]
Samuelson, P., 1955. Diagrammatic Exposition of a Theory of Public Expenditure. Review of Economics and Statistics, 37, pp. 350-356 [ CrossRef]
Shah, A., 1998. Balance, accountability, and responsiveness: lessons about decentralization. World Bank Policy Working Paper, No. 2021.
Shen, C., Jin, J. and Zou, H., 2012. Fiscal Decentralization in China: History, Impact, Challenges and Next Steps. Annals of Economics and Finance, 13, pp. 1-51.
Smoke, P., 2005. The Rules of the Intergovernmental Game in East Asia: Decentralization Frameworks and Processes. In: East Asia Decentralizes: Making Local Government Work. Washington: The World Bank, pp. 25-52 [ CrossRef]
Stansel, D., 2005. Local Decentralization and Local Economic Growth: A Cross-Sectional Examination of U.S. Metropolitan Areas. Journal of Urban Economics, 57, pp. 55-72 [ CrossRef]
Tanzi, V., 1996. Fiscal Federalism and Decentralization: A Review of Some Efficiency and Macroeconomic Aspects. In: M. Bruno and Pleskovic, eds. Annual World Bank Conference on Development Economics. Washington: The World Bank, pp. 295-316 [ CrossRef]
Tiebout, C., 1956. A pure theory of local expenditures. Journal of Political Economy, 64, pp. 416-424 [ CrossRef]
Tosun, M and Yilmaz, S., 2008. Decentralization, economic development, and growth in Turkish provinces. World Bank Policy Research Working Paper, No. 4725 [ CrossRef]
Von Braun, J. and Grote, U., 2002. Does decentralization serve the poor? In: E. Ahmad and V. Tanzi, eds. Managing fiscal decentralization. London: Routledge, pp. 68-96 [ CrossRef]
Wallis, J. and Oates, W., 1988. Decentralization in the public sector: an empirical study of state and local government. In H. Rosen, ed. Fiscal federalism: quantitative studies. Chicago: University of Chicago Press, pp. 5-32.
Wetzel, D., 2001. Decentralization in the Transition Economies: Challenges and the Road Ahead. Washington: The World Bank.
Woller, G. M. and Phillips, K., 1998. Fiscal Decentralization and LDC Economic Growth: An Empirical Investigation. Journal of Development Studies, 34, pp. 139-148.
World Bank, 2009. Local Government Discretion and Accountability: Application of a Local Governance Framework. World Bank Social Development Department Report, No. 49059-GLB.
Xie, D., Zou, H. and Davoodi, H., 1999. Fiscal Decentralization and Economic Growth in the United States. Journal of Urban Economics, 45, pp. 228-239 [ CrossRef]
Agrawal, A. and Ribot, J. C., 1999. Accountability in Decentralization: A Framework with South Asian and West African Cases. J ournal of Developing Areas, 33(4), pp. 473-502.
Akai, N. and Sakata, M., 2002. Fiscal Decentralization Contributes to Economic Growth: Evidence from State-Level Cross-Section Data for the United States. Journal of Urban Economics, 52(1), pp. 93-108 [ CrossRef]
Arikan, G. G., 2004. Fiscal Decentralization: A Remedy for Corruption? International Tax and Public Finance, 11, pp. 175-195 [ CrossRef]
Asante, F. and Ayee, J., 2007. Decentralization and poverty reduction. In E. Aryeetey, ed. The Economy of Ghana: Analytical Perspectives on Stability, Growth, & Poverty. Woeli Publishing Services: Accra, pp. 325-347.
Bahl, R., 1999. Fiscal decentralization as development policy. Public Budgeting & Finance, 19(2), pp. 59-75 [ CrossRef]
Balisacan, A. and Fuwa, N., 2004. Going Beyond Cross-Country Averages: Growth, Inequality, and Poverty Reduction in the Philippines. World Development, 32(11), pp. 1891-1907 [ CrossRef]
Balisacan, A. and Pernia, E., 2002. Probing Beneath Cross-National Averages: Poverty, Inequality, and Growth in the Philippines. Asian Development Bank ERD Working Paper Series, No. 7.
Bardhan, P., 2002. Decentralization of Governance and Development. Journal of Economic Perspectives, 16(4), pp. 185-225 [ CrossRef]
Boadway, R. and Shah, A., 2009. Fiscal Federalism: Principles and Practices of Multiorder Governance. New York: Cambridge University Press [ CrossRef]
Bodman, P., 2010. Fiscal Decentralisation and Economic Growth in the OECD. Applied Economics, 43(23), pp. 3021-3035 [ CrossRef]
Boone, C., 2003. Decentralization as Political Strategy in West Africa. Comparative Political Studies, 36, pp. 355-380 [ CrossRef]
Davoodi, H. and Zou, H., 1998. Fiscal decentralization and economic growth: a cross-country study. Journal of Urban Economics, 43, pp. 244.257 [ CrossRef]
Faguet, J., 2004. Does decentralization increase government responsiveness to local needs? Evidence from Bolivia. Journal of Public Economics, 88, pp. 867-893 [ CrossRef]
Faguet, J., 2009. Governance from below in Bolivia: A theory of local government with two empirical tests. Latin American Politics and Society, 51, pp. 29-68 [ CrossRef]
Gemmell, N., Kneller, R. and Sanz, I., 2013. Fiscal Decentralization and Economic Growth: Spending versus Revenue Decentralization. Economic Inquiry, 51, pp. 1915-1931 [ CrossRef]
Goel, R. K. and Saunoris, J. W., 2016. Virtual Versus Physical Government Decentralization: Effects on Corruption and the Shadow Economy. Public Budgeting and Finance, 36, pp. 68-93 [ CrossRef]
Hammond, G. W. and Tosun, M. S., 2011. The Impact of Local Decentralization on Economic Growth: Evidence from U.S. Counties. Journal of Regional Science, 51, pp. 47-64 [ CrossRef]
Hutchcroft, P. D., 2012. Re-slicing the Pie of Patronage: The Politics of the Internal Revenue Allotment in the Philippines, 1991-2010. Philippine Reviewof Economics, 49, pp. 109-134.
Jutting, J. [et al.], 2005. What Makes Decentralisation in Developing Countries Pro-poor? E uropean Journal of Development Research, 17, pp. 626-648 [ CrossRef]
Kim, J., 2018. Fiscal decentralisation and inclusive growth: An overview. In: OECD Fiscal Federalism Studies: Fiscal Decentralisation and Inclusive Growth /J. Kim and S. Dougherty, eds, pp. 9-20. Paris: OECD Publishing and Seoul: Korea Institute of Public Finance [ CrossRef]
Kubal, M., 2006. Contradictions and constraints in Chile's health care and education decentralization. Latin American Politics and Society, 48, pp. 105-135 [ CrossRef]
Llanto, G., 2009. Fiscal decentralization and local finance reforms in the Philippines. Philippine Institute for Development Studies Discussion Paper Series, No. 2009-10.
Musgrave, R., 1959. The Theory of Public Finance. New York: McGraw-Hill.
Oates, W., 1972. Fiscal Federalism. New York: Harcourt Brace Jovanovich.
Oates, W., 2005. Toward a Second-Generation Theory of Fiscal Federalism. International Tax and Public Finance, 12, pp. 349-373 [ CrossRef]
Persson, T. and Tabellini, G., 2000. Political Economics: Explaining Economic Policy. Cambridge and London: Massachusetts Institute of Technology Press.
Prud’homme, R., 1995. The Dangers of Decentralization. The World Bank Research Observer, 10, pp. 201-220 [ CrossRef]
Qiao, B., Martinez-Vasquez, J. and Xu, Y., 2008. Growth and Equity Tradeoff in Decentralization Policy: China's Experience. Journal of Development Economics, 86, pp. 112-128 [ CrossRef]
Rodriguez-Pose, A. and Ezcurra, R., 2011. Is Fiscal Decentralization Harmful for Economic Growth? Evidence from the OECD countries. Journal of Economic Geography, 11, pp. 619-643 [ CrossRef]
Rodriguez-Pose, A. and Gill, N., 2003. The Global Trend Towards Devolution and Its Implications. Environment and Planning C: Government and Policy, 21, pp. 333-351 [ CrossRef]
Rodriguez-Pose, A., Tijmstra, S. A. R. and Bwire, A., 2009. Fiscal Decentralisation, Efficiency, and Growth. Environment and Planning A: Economy and Space, 41, pp. 2041-2062 [ CrossRef]
Samuelson, P., 1954. The Pure Theory of Public Expenditure. Review of Economics and Statistics, 36, pp. 387-389 [ CrossRef]
Samuelson, P., 1955. Diagrammatic Exposition of a Theory of Public Expenditure. Review of Economics and Statistics, 37, pp. 350-356 [ CrossRef]
Shah, A., 1998. Balance, accountability, and responsiveness: lessons about decentralization. World Bank Policy Working Paper, No. 2021.
Shen, C., Jin, J. and Zou, H., 2012. Fiscal Decentralization in China: History, Impact, Challenges and Next Steps. Annals of Economics and Finance, 13, pp. 1-51.
Smoke, P., 2005. The Rules of the Intergovernmental Game in East Asia: Decentralization Frameworks and Processes. In: East Asia Decentralizes: Making Local Government Work. Washington: The World Bank, pp. 25-52 [ CrossRef]
Stansel, D., 2005. Local Decentralization and Local Economic Growth: A Cross-Sectional Examination of U.S. Metropolitan Areas. Journal of Urban Economics, 57, pp. 55-72 [ CrossRef]
Tanzi, V., 1996. Fiscal Federalism and Decentralization: A Review of Some Efficiency and Macroeconomic Aspects. In: M. Bruno and Pleskovic, eds. Annual World Bank Conference on Development Economics. Washington: The World Bank, pp. 295-316 [ CrossRef]
Tiebout, C., 1956. A pure theory of local expenditures. Journal of Political Economy, 64, pp. 416-424 [ CrossRef]
Tosun, M and Yilmaz, S., 2008. Decentralization, economic development, and growth in Turkish provinces. World Bank Policy Research Working Paper, No. 4725 [ CrossRef]
Von Braun, J. and Grote, U., 2002. Does decentralization serve the poor? In: E. Ahmad and V. Tanzi, eds. Managing fiscal decentralization. London: Routledge, pp. 68-96 [ CrossRef]
Wallis, J. and Oates, W., 1988. Decentralization in the public sector: an empirical study of state and local government. In H. Rosen, ed. Fiscal federalism: quantitative studies. Chicago: University of Chicago Press, pp. 5-32.
Wetzel, D., 2001. Decentralization in the Transition Economies: Challenges and the Road Ahead. Washington: The World Bank.
Woller, G. M. and Phillips, K., 1998. Fiscal Decentralization and LDC Economic Growth: An Empirical Investigation. Journal of Development Studies, 34, pp. 139-148.
World Bank, 2009. Local Government Discretion and Accountability: Application of a Local Governance Framework. World Bank Social Development Department Report, No. 49059-GLB.
Xie, D., Zou, H. and Davoodi, H., 1999. Fiscal Decentralization and Economic Growth in the United States. Journal of Urban Economics, 45, pp. 228-239 [ CrossRef]
|


