5844
Views
1138
Downloads |
Distribution of household assets in Croatia
Marina Kunovac* 
Article | Year: 2020 | Pages: 265 - 297 | Volume: 44 | Issue: 3 Received: October 21, 2019 | Accepted: February 24, 2020 | Published online: September 1, 2020
|

FULL ARTICLE
FIGURES & DATA
REFERENCES
CROSSMARK POLICY
METRICS
LICENCING
PDF
|
|
Gross sample
|
Net sample
|
Population
|
|
Strata
|
Number of
randomly selected occupied dwellings in the strata*
|
% share
|
Number of
respondent households in HFCS
|
% share
|
Number of
occupied dwellings in population
|
% share
|
|
Central Croatia, city, HMR < 120 square meters
|
220
|
6
|
74
|
5
|
124,958
|
8
|
|
Central Croatia, municipality, HMR < 120 square meters
|
150
|
4
|
59
|
4
|
96,573
|
6
|
|
City of Zagreb, HMR < 120 square meters
|
830
|
21
|
133
|
10
|
279,420
|
19
|
|
Eastern Croatia, city, HMR < 120 square meters
|
485
|
12
|
229
|
17
|
230,580
|
15
|
|
Eastern Croatia, municipality, HMR < 120 square meters
|
225
|
6
|
128
|
9
|
140,397
|
9
|
|
Adriatic Coast, city, HMR < 120 square meters
|
480
|
12
|
158
|
12
|
232,817
|
16
|
|
Adriatic Coast, municipality, HMR < 120 square meters
|
230
|
6
|
64
|
5
|
128,137
|
9
|
|
Cities of Split and Rijeka, HMR < 120 square meters
|
380
|
10
|
103
|
8
|
111,113
|
7
|
|
Central Croatia, city, HMR >
120 square meters
|
155
|
4
|
63
|
5
|
26,420
|
2
|
|
Central Croatia, municipality, HMR > 120 square meters
|
100
|
3
|
52
|
4
|
19,602
|
1
|
|
City of Zagreb, HMR > 120
square meters
|
195
|
5
|
60
|
4
|
20,557
|
1
|
|
Eastern Croatia, city, HMR >
120 square meters
|
225
|
6
|
125
|
9
|
33,039
|
2
|
|
Eastern Croatia, municipality, HMR
> 120 square meters
|
95
|
2
|
50
|
4
|
18,635
|
1
|
|
Adriatic Coast, city, HMR >120
square meters
|
115
|
3
|
28
|
2
|
17,641
|
1
|
|
Adriatic Coast, municipality, HMR
> 120 square meters
|
85
|
2
|
21
|
2
|
14,064
|
1
|
|
Cities of Split and Rijeka, HMR
> 120 square meters
|
30
|
1
|
10
|
1
|
2,605
|
0,2
|
|
TOTAL
|
4000
|
100
|
1357
|
100
|
1,496,558
|
100
|
Note: Geographical location “Adriatic Coast” includes the following counties: Primorje-Gorski Kotar, Lika-Senj, Zadar, Šibenik-Knin, Split-Dalmatia, Istria and Dubrovnik-Neretva. Geographical location “Eastern Croatia” includes the following counties: Sisak-Moslavina, Karlovac, Bjelovar-Bilogora, Virovitica-Podravina, Požega-Slavonia, Brod-Posavina, Osijek-Baranja and Vukovar-Srijem. Geographical location “Central Croatia” includes the following counties: Zagreb, Krapina-Zagorje, Varaždin, Koprivnica-Križevci and Međimurje. Source: ECB and author’s calculations.
|
Components of net assets
|
Share of households, in %
|
Median, in EUR thousands
|
Mean, in EUR thousands
|
Share in total value of
assets/liabilities
|
|
|
|
(1) Real assets
|
94
|
70
|
114
|
97
|
|
|
Main residence (85%)
|
85
|
66
|
94
|
73
|
|
|
Other real estate
|
23
|
20
|
54
|
11
|
|
|
Vehicles
|
69
|
4
|
6
|
4
|
|
|
Other valuables
|
4
|
2
|
6
|
0
|
|
|
Self-employment business assets*
|
5
|
25
|
209
|
9
|
|
|
(2) Financial assets
|
82
|
0.5
|
5
|
3
|
|
|
Sight accounts
|
80
|
0.2
|
9
|
1
|
|
|
Savings accounts
|
14
|
5
|
13
|
2
|
|
|
Voluntary pension funds/ whole life insurance
|
6
|
5
|
6
|
0
|
|
|
Mutual funds
|
1.4
|
3
|
4
|
0
|
|
|
Money owed to household
|
3
|
2
|
6
|
0
|
|
|
Shares
|
5
|
2
|
4
|
0
|
|
|
Bonds
|
0.4
|
0.1
|
69
|
0
|
|
|
Other types of financial assets
|
0.7
|
0
|
0.2
|
0
|
|
|
(3) Liabilities
|
41
|
2
|
10
|
-
|
|
|
Mortgage debt
|
9
|
20
|
30
|
66
|
|
|
for main residence
|
9
|
20
|
30
|
63
|
|
|
for other real estate
|
0.4
|
16
|
26
|
3
|
|
|
Non-mortgage debt
|
36
|
2
|
4
|
34
|
|
|
Credit lines/overdrafts
|
27
|
1
|
1
|
9
|
|
|
Credit card debt
|
6
|
0.4
|
0.8
|
1
|
|
|
Other non-mortgage loans
|
13
|
5
|
8
|
24
|
|
|
(1+2) Gross assets
|
98
|
67
|
111
|
-
|
|
|
((1+2)-3) Net assets
|
100
|
61
|
107
|
-
|
|
Note: *Self-employment business assets means any household-owned component of real assets (real estates, vehicles or valuables) used in running a self-employment business. Gross assets are calculated as the sum of real and financial assets. Net assets equal the amount of gross assets net of household liabilities. Since the survey has been harmonised across EU member states, its values are expressed in euros. Median and means are calculated for the households that own a certain category of assets. Source: ECB and author’s calculations.
Source: ECB and author’s calculations.
Source: ECB and author's calculations.
Source: ECB and author’s calculations.
Source: ECB and author’s calculations.
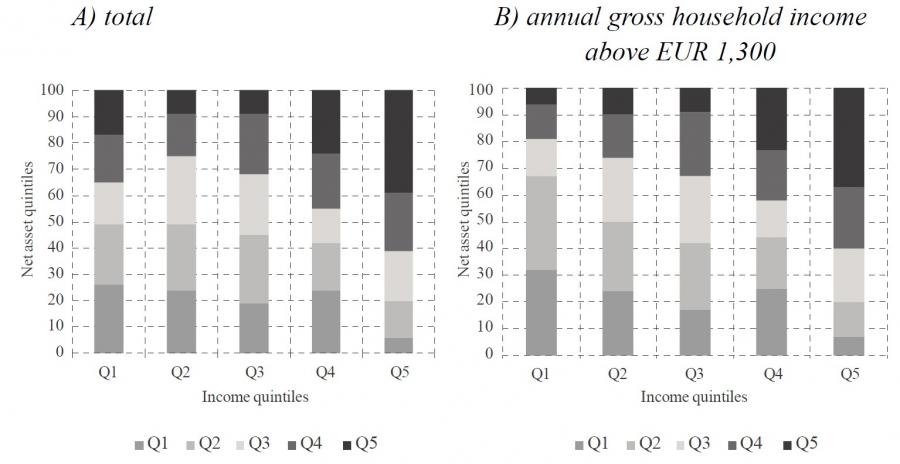 Source: ECB and author’s calculations.
Source: ECB and author’s calculations.
Note: Geographical location “Adriatic Coast” includes the following counties: Primorje-Gorski Kotar, Lika-Senj, Zadar, Šibenik-Knin, Split-Dalmatia, Istria and Dubrovnik-Neretva. Geographical location “Eastern Croatia” includes the following counties: Sisak-Moslavina, Karlovac, Bjelovar-Bilogora, Virovitica-Podravina, Požega-Slavonia, Brod-Posavina, Osijek-Baranja and Vukovar-Srijem. Geographical location “Central Croatia” includes the following counties: Zagreb, Krapina-Zagorje, Varaždin, Koprivnica-Križevci and Međimurje. Source: ECB and author’s calculations.
Note![]() : Geographical location “Adriatic Coast” includes the following counties: Primorje-Gorski Kotar, Lika-Senj, Zadar, Šibenik-Knin, Split-Dalmatia, Istria and Dubrovnik-Neretva. Geographical location “Eastern Croatia” includes the following counties: Sisak-Moslavina, Karlovac, Bjelovar-Bilogora, Virovitica-Podravina, Požega-Slavonia, Brod-Posavina, Osijek-Baranja and Vukovar-Srijem. Geographical location “Central Croatia” includes the following counties: Zagreb, Krapina-Zagorje, Varaždin, Koprivnica-Križevci and Međimurje. Source: ECB and author’s calculations.
|
|
|
Net asset quntiles
|
|
|
|
1
|
2
|
3
|
4
|
5
|
|
Income per quintiles
|
1
|
0.14***
|
0.14***
|
-0.04
|
-0.05
|
-0.20***
|
|
2
|
0.16***
|
0.13***
|
0.05
|
-0.06
|
-0.28***
|
|
3
|
0.10***
|
0.11***
|
0.01
|
0.00
|
-0.22***
|
|
4
|
0.11***
|
0.05
|
-0.05
|
-0.03
|
-0.08**
|
|
HMR Characteristics
(inheritance and location)
|
Inheritance_HMR
|
-0.11***
|
0.07***
|
0.05*
|
0.01
|
-0.02
|
|
HMR_City of Zagreb
|
0.00
|
-0.21***
|
-0.05
|
0.07*
|
0.19***
|
|
HMR_Primorje
|
0.02
|
-0.24***
|
-0.06**
|
0.09***
|
0.18***
|
|
HMR_Central Croatia
|
0.00
|
-0.03
|
-0.08***
|
0.03
|
0.08***
|
|
Socio-demographic
characteristics of reference person
|
Sex (male)
|
-0.02
|
0.04*
|
-0.03
|
-0.02
|
0.02
|
|
Retirement
|
-0.01
|
-0.09**
|
0.02
|
0.00
|
0.09***
|
|
Unemployed/non-active
|
0.05
|
0.02
|
-0.06
|
-0.01
|
0.00
|
|
Self-employed
|
-0.24***
|
0.06
|
-0.14
|
0.08
|
0.24***
|
|
Secondary education
|
-0.14***
|
-0.06
|
0.03
|
0.06
|
0.12*
|
|
Higher education
|
-0.19***
|
0.13**
|
0.05
|
0.08
|
0.20***
|
|
35-45 age group
|
-0.13***
|
-0.01
|
0.04
|
0.05
|
0.05
|
|
45-64 age group
|
-0.18***
|
0.00
|
0.07
|
0.01
|
0.11**
|
|
65+ age group
|
-0.27***
|
0.07
|
0.04
|
0.05
|
0.12**
|
|
Household characteristics
|
Number of children in household
|
0.05***
|
0.02
|
0.00
|
-0.05***
|
-0.01
|
|
Number of household members
|
-0.03***
|
-0.02*
|
0.00
|
0.03**
|
0.02*
|
|
Indicators of debt burden
|
Mortgage for HMR
|
-0.08**
|
0.11**
|
0.04
|
-0.02
|
-0.05
|
|
Consumer debt
|
0.07***
|
-0.03
|
-0.03
|
0.03
|
-0.03
|
|
Other characteristics
|
Social benefits recipients
|
0.07**
|
0.02
|
-0.05
|
0.04
|
-0.08*
|
|
Willingness to take risks
|
0.01
|
-0.08
|
-0.06
|
0.02
|
0.10**
|
* Generalized ordered probit model, marginal effects Note: Symbols ***, ** and * indicate statistical significance of 99%, 95% and 90% respectively. Reference categories: for income – Income_5quintile group for the HMR location – _HMR location Eastern Croatia; for labour market status – Employed; for educational attainment – Primary education or no education, for age – Up to 34 years of age. Source: ECB and author’s calculations.
|
Information on the reference person
|
HFCS
|
EU SILC
|
|
Education
|
Primary
|
24
|
26
|
|
Secondary
|
59
|
57
|
|
Higher
|
16
|
17
|
|
Age
|
Under 24
|
25
|
26
|
|
25-54
|
37
|
41
|
|
55-64
|
17
|
14
|
|
65+
|
21
|
19
|
|
Labour market status
|
Employed
|
45
|
38
|
|
Self-employed
|
3
|
4
|
|
Retirement
|
42
|
31
|
|
Non-active/unemployed
|
9
|
27
|
|
Average household size (no.of individuals)
|
2.8
|
2.8
|
|
Information on main residence
|
|
|
|
|
Owners
|
85
|
90
|
|
Renters
|
15
|
10
|
Note: Information on the reference person for the HFCS was calculated by using the estimated weights and all five versions of data imputations. Information on the reference persons for the EU-SILC was taken from the Eurostat data. Source: ECB and Eurostat (EU SILC).
|
Components of net assets
|
Gini coefficient
|
|
|
|
Real assets
|
0.59
|
|
|
Main residence
|
0.56
|
|
|
Other real estate
|
0.93
|
|
|
Vehicles
|
0.69
|
|
|
Other valuables
|
0.99
|
|
|
Self-employment business assets
|
0.99
|
|
|
Financial assets
|
0.88
|
|
|
Current accounts
|
0.83
|
|
|
Savings accounts
|
0.96
|
|
|
Voluntary pension/life insurance
|
0.99
|
|
|
Mutual funds
|
0.99
|
|
|
Money owed to household
|
0.99
|
|
|
Shares
|
0.98
|
|
|
Bonds
|
0.99
|
|
|
Other types of financial assets
|
0.96
|
|
|
Liabilities
|
0.90
|
|
|
Mortgage debt
|
0.96
|
|
|
Non-mortgage debt
|
0.89
|
|
|
Total annual gross income
|
0.51
|
|
|
Gross assets
|
0.59
|
|
|
Net assets
|
0.61
|
|
Source: ECB and author’s calculations.
|
|
|
Net asset quintiles
|
|
|
|
1
|
2
|
3
|
4
|
5
|
|
Income per quintiles
(OECD)
|
1
|
0.13***
|
0.13***
|
-0.01
|
-0.06
|
-0.18***
|
|
2
|
0.16***
|
0.12***
|
0.01
|
-0.07*
|
-0.22***
|
|
3
|
0.10***
|
0.10**
|
0.03
|
-0.05
|
-0.18***
|
|
4
|
0.06
|
0.05
|
0.03
|
-0.05
|
-0.10***
|
|
HMR Characteristics
(inheritance and location)
|
Inheritance_HMR
|
-0.11***
|
0.08***
|
0.04*
|
0.01
|
-0.02
|
|
HMR_City of Zagreb
|
0.00
|
-0.22***
|
-0.04
|
0,06*
|
0.21***
|
|
HMR_Primorje
|
0.03
|
-0.24***
|
-0.07***
|
0.09***
|
0.18***
|
|
HMR_Central Croatia
|
0.00
|
-0.03
|
-0.08**
|
0.02
|
0.08***
|
|
Socio-demographic
characteristics of reference person
|
Sex (male)
|
-0.01
|
0.04*
|
-0.03
|
-0.02
|
0.02
|
|
Retirement
|
-0.02
|
-0.08*
|
0.02
|
0.01
|
0.08**
|
|
Unemployed/non-active
|
0.04
|
0.03
|
-0.05
|
-0.01
|
-0.01
|
|
Self-employed
|
-0.26***
|
0.06
|
-0.11
|
0.08
|
0.23***
|
|
Secondary education
|
-0.14***
|
-0.06
|
0.03
|
0.06
|
0.10
|
|
Higher education
|
-0.17***
|
-0.11**
|
0.03
|
0.07
|
0.18***
|
|
35-45 age group
|
-0.13***
|
-0.02
|
0.04
|
0.05
|
0.06
|
|
45-64 age group
|
-0.18***
|
-0.01
|
0.06
|
0.01
|
0.12**
|
|
65+ age group
|
-0.27***
|
0.06
|
0.04
|
0.05
|
0.13**
|
|
Household characteristics
|
Number of children in household
|
0.05***
|
0.03
|
-0.01
|
-0.05***
|
-0.02
|
|
Number of household members
|
-0.04***
|
-0.03***
|
0.00
|
0.03***
|
0.05***
|
|
Indicators of debt burden
|
Mortgage for HMR
|
-0.08*
|
0.10**
|
0.05
|
-0.03
|
-0.06
|
|
Consumer debt
|
0.07***
|
-0.02
|
-0.04*
|
0.03
|
-0.03
|
|
Other characteristics
|
Social benefits recipients
|
0.07**
|
0.02
|
-0.05
|
0.03
|
-0.07*
|
|
Willingness to take risks
|
0.02
|
-0.07
|
-0.05
|
0.01
|
0.09*
|
Note: Symbols ***, ** and * indicate statistical significance of 99%, 95% and 90% respectively. Reference categories: for income – Income_5quntile group for the HMR location – _HMR location Eastern Croatia; for labour market status – Employed; for educational attainment – Primary education or no education, for age – Up to 34 years of age. Source: ECB and author’s calculations.
|
|
|
Net asset quintiles
|
|
|
|
1
|
2
|
3
|
4
|
5
|
|
Income per quintiles >
EUR 1,300
|
1
|
0.28***
|
0.07
|
-0.01
|
-0.08
|
-0.26***
|
|
2
|
0.18***
|
0.06
|
-0.03
|
-0.03
|
-0.25***
|
|
3
|
0.14***
|
0.09**
|
-0.01
|
-0.04
|
-0.18***
|
|
4
|
0.13***
|
0.02
|
-0.05
|
-0.02
|
-0.09*
|
|
HMR Characteristics
(inheritance and location)
|
Inheritance_HMR
|
-0.15***
|
0.12***
|
0.04
|
0.00
|
-0.02
|
|
HMR_City of Zagreb
|
0.05
|
-0.25***
|
-0.06
|
0.06*
|
0.20***
|
|
HMR_Primorje
|
0.04
|
-0.27***
|
-0.06*
|
0.11***
|
0.18***
|
|
HMR_Central Croatia
|
0.00
|
-0.04
|
-0.08**
|
0.06*
|
0.06**
|
|
Socio-demographic
characteristics of reference person
|
Sex (male)
|
-0.01
|
0.04
|
-0.03
|
-0.03
|
0.02
|
|
Retirement
|
-0.02
|
-0.03
|
-0.01
|
-0.01
|
0.08**
|
|
Unemployed/non-active
|
0.01
|
0.02
|
-0.01
|
0.00
|
-0.01
|
|
Self-employed
|
-0.97
|
0.79
|
-0.11
|
0.04
|
0.25***
|
|
Secondary education
|
-0.13***
|
-0.08
|
0.05
|
0.01
|
0.15
|
|
Higher education
|
-0.12**
|
-0.20***
|
0.08
|
0.02
|
0.22*
|
|
35-45 age group
|
-0.16***
|
0.06
|
0.00
|
0.04
|
0.06
|
|
45-64 age group
|
-0.20***
|
0.02
|
0.04
|
0.03
|
0.12**
|
|
65+ age group
|
-0.32***
|
0.11*
|
0.03
|
0.05
|
0.13**
|
|
Household characteristics
|
Number of children in household
|
0.04**
|
0.04*
|
-0.01
|
-0.05**
|
-0.02
|
|
Number of household members
|
-0.02
|
-0.04**
|
0.00
|
0.03**
|
0.02*
|
|
Indicators of debt burden
|
Mortgage for HMR
|
-0.07*
|
0.14***
|
0.03
|
-0.04
|
-0.06
|
|
Consumer debt
|
0.08***
|
-0.04
|
-0.03
|
0.02
|
-0.03
|
|
Other characteristics
|
Social benefits recipients
|
0.07**
|
0.03
|
-0.08*
|
0.05
|
-0.07
|
|
Willingness to take risks
|
-0.04
|
-0.07
|
-0.03
|
0.06
|
0.08
|
* Generalized ordered probit model, marginal effects, sample excludes the households that reported annual gross income lower than EUR 1,300 and the accompanying income and net asset quintiles modified accordingly Note: Symbols ***, ** and * indicate statistical significance of 99%, 95% and 90% respectively. Reference categories: for income – Income_5quntile group for the HMR location – _HMR location Eastern Croatia; for labour market status – Employed; for educational attainment – Primary education or no education, for age – Up to 34 years of age. Source: ECB and author’s calculations.
|
|
|
OLS
(Model 1)
|
OLS
(Model 2)
|
Ordered probit model
(Model 3)
|
|
Income per quintiles
(OECD)
|
1
|
-0.78***
|
|
-0.71***
|
|
2
|
-1.16***
|
|
-0.88***
|
|
3
|
-0.69***
|
|
-0.64***
|
|
4
|
-0.41**
|
|
-0.39***
|
|
|
log (annual gross income)
|
|
-0.39***
|
|
|
|
log (annual gross income)^2
|
|
0.04***
|
|
|
HMR Characteristics
(inheritance and location)
|
Inheritance_HMR
|
0.55***
|
0.55***
|
0.15**
|
|
HMR_City of Zagreb
|
0.50**
|
0.54***
|
0.61***
|
|
HMR_Primorje
|
0.38**
|
0.40**
|
0.53***
|
|
HMR_Central Croatia
|
0.23
|
0.24
|
0.15*
|
|
Socio-demographic
characteristics of reference person
|
Sex (male)
|
0.06
|
0.07
|
0.03
|
|
Retirement
|
0.48**
|
0.23
|
0.29***
|
|
Unemployed/non-active
|
-0.45**
|
-0.42*
|
-0.12
|
|
Self-employed
|
1.03***
|
1.02***
|
0.97***
|
|
Secondary education
|
0.59**
|
0.77***
|
0.50***
|
|
Higher education
|
0.81**
|
1.03***
|
0.75***
|
|
35-45 age group
|
0.75***
|
|
0.48***
|
|
45-64 age group
|
0.97***
|
|
0.69***
|
|
65+ age group
|
1.06***
|
|
0.81***
|
|
|
log (age)
|
|
1.21***
|
|
|
Household characteristics
|
Number of children in household
|
-0.27**
|
-0.25**
|
-0.18***
|
|
Number of household members
|
0.33***
|
0.26***
|
0.22***
|
|
Indicators of debt burden
|
Mortgage for HMR
|
0.24
|
0.24
|
0.02
|
|
Consumer debt
|
0.15
|
0.18
|
-0.17**
|
|
Other characteristics
|
Social benefits recipients
|
-0.57**
|
-0.52**
|
-0.23**
|
|
Willingness to take risks
|
0.37
|
0.54*
|
0.16
|
|
|
Constant
|
8.44
|
3.96
|
|
|
Wald thest for homogeneity of coefficients
|
chi2
|
|
|
219.84
|
|
Prob>chi2
|
|
|
0.000
|
Note: The Model 2 of the least squares estimator includes the income square due to the non-linear effect of income. The Model 3 is an ordered probit model (homogeneous coefficient for different categories of the dependent variable). The results of the Model 3 show the estimated model coefficients rather than marginal effects. The Table also shows the results of the Wald test that rejects the homogeneity assumption (parallel line assumption test). Source: ECB and author’s calculations.
Table 1Structure of households in gross and net sample and in the overall population DISPLAY Table
Table 2Components of Household Assets and Liabilities DISPLAY Table
Figure 1ADistribution of net assets, in EUR thousands DISPLAY Figure
Figure 1BTopology of household assets (most important components), share of households DISPLAY Figure
Figure 2Lorenz curve for real, financial and net assets and income DISPLAY Figure
Figure 3Socio-demographic characteristics of households and quintiles of net assets, in % DISPLAY Figure
Figure 4Joint distribution of income and net asse DISPLAY Figure
Figure 5AHousehold main residence – tenure status and deciles of net assets, in % DISPLAY Figure
Figure 5BWay of acquiring the household main residence and deciles of net assets, in % DISPLAY Figure
Figure 6ARegional heterogeneity of households with regard to the value of net assets DISPLAY Figure
Figure 6BComparison of net asset percentiles for a household in the region and at the level of Croatia DISPLAY Figure
Table 3Probability of positioning a household in a certain net asset quintile* DISPLAY Table
Table A4Comparison of socio-demographic characteristics of households* DISPLAY Table
Table A5Gini coefficient for subcomponents of real and financial assets DISPLAY Table
Table A6Probability of positioning a household in a certain net asset quintile* DISPLAY Table
Table A7Probability of positioning a household in a certain net asset quintile* DISPLAY Table
Table A8Least squares estimator (Models 1 and 2) and ordered probit DISPLAY Table
* The author wants to thank the two anonymous referees, as well as Maja Bukovšak, Vedran Šošić, Krunoslav Zauder, Mate Rosan, Ervin Duraković, Lana Ivičić and Ivica Rubil for their useful comments and suggestions. I would like to express my gratitude to Mrs Frédérique Savignac from the HFCN, the co-author in the paper by Arrondel, Roger and Savignac (  2014 ) for providing a part of the Stata module to integrate generalized ordered probit models with multiple imputed and weighted data. This paper presents the views of the author and should not be interpreted as reflecting the views or opinions of the Croatian National Bank.
1 The Household Finance and Consumption Survey (HFCS) was carried out in coordination with the Euro¬pean Central Bank. The European Central Bank has already coordinated two previous HFCS waves, the first one in the 2008-2010 period and the second in 2013. Since Croatia entered the EU in July 2013, the CNB joined the survey in the third wave.
2 By comparing the data with those collected in the EU in the second survey wave (2013), one can observe higher participation rate of the household main residence in Croatia compared to other EU countries (where an average of 62% of households owned the HMR the median value of which stood at 165 thousand euros (ECB, 2016)).
3 According to the HFCS methodology prescribed by the ECB, the survey did not cover institutional households.
4 Recent studies (e.g. Blanchet, Flores and Morgan, 2018) indicate that the combination of survey and tax data represent the most detailed adjustment in case of underrepresentation of richer households in wealth surveys. The authors propose a statistical procedure that combines survey income microdata and tax data on the num¬ber of taxpayers by income brackets, which gives a new adjusted dataset with new weights and observations with adjusted income values. At the same time, all the other survey data remain consistent.
5 To take into account unequal probability of participation in the sample among households.
6 Models for estimation of missing values for particular variables are pre-defined within the HFCN.
7 A similar approach was applied in Arrondel, Roger and Savignac ( 2014) and Georgokoponus ( 2019). Weights are based on the data on geographic distribution of households and respondents’ age and sex. Controlling for these variables in the model is achieved by their direct inclusion in the regression.
8 The selected parts of the Chapter were presented in CNB ( 2019).
9 Details on household liabilities collected in the HFCS are described in the CNB ( 2019) and Rosan and Zauder ( 2019). Household debt distribution in Croatia had previously been analysed by Herceg and Šošić ( 2011) and Herceg and Nestić ( 2014). However, these analyses were based on the Household Consumption Survey of the CBS. The survey included micro debt data and the main socio-demographic characteristics of households. On the other hand, the data on assets (real or financial) were not available.
10 Privatization of the socially owned housing stock was implemented in accordance with the Act on the Sale of Apartments with Tenancy Rights (Zakon o prodaji stanova nad kojima postoji stanarsko pravo, NN 27/91).
11 Austria is is an interesting example in that sense where inequality in the distribution of financial assets is lower than inequality in the distribution of real assets, given the low share of main residence ownership (45%). For more details, see Fessler, Linder and Schurz ( 2019).
12 The data from the CBS Statistics on Income and Living Conditions (SILC) for 2016 point to somewhat lower income inequality in Croatia, but in case of the CBS SILC, the Gini coefficient is significantly lower and stands at 0.3 (CBS, 2017). The results are not completely comparable because the Gini coefficient from CBS SILC covers net income, whereas all the data collected in the HFCS relate to gross amounts, i.e. includ-ing taxes and social insurance contributions.
13 The reference person is the one chosen by household members as the person most informed about household finances.
14 Income components included in the definition of the annual gross income and components of all the other variables whose values are collected in the survey are available in CNB ( 2019).
15 For more details see Christiaensen et al. ( 2019).
16 Selection of dependent variables and methodological approach is similar to those presented in Arrondel, Roger and Savignac ( 2014), Martinez and Uribe ( 2018) and Georgokoponus ( 2019).
17 In line with the life-cycle hypothesis according to Modigliani and Brumberg ( 1954).
18 For the discussion on the effect of debt and different types of social benefits on inequality in the distribu¬tion of assets, see Maestri, Bogliacino and Salverda ( 2014).
19 Other research has also backed this result (e.g. Arrondel, Roger and Savignac, 2014; Leitner, 2015).
|
|
September, 2020
III/2020
|





