5844
Views
1138
Downloads |
Distribution of household assets in Croatia
Marina Kunovac* 
Article | Year: 2020 | Pages: 265 - 297 | Volume: 44 | Issue: 3 Received: October 21, 2019 | Accepted: February 24, 2020 | Published online: September 1, 2020
|

FULL ARTICLE
FIGURES & DATA
REFERENCES
CROSSMARK POLICY
METRICS
LICENCING
PDF
|
|
Gross sample
|
Net sample
|
Population
|
|
Strata
|
Number of
randomly selected occupied dwellings in the strata*
|
% share
|
Number of
respondent households in HFCS
|
% share
|
Number of
occupied dwellings in population
|
% share
|
|
Central Croatia, city, HMR < 120 square meters
|
220
|
6
|
74
|
5
|
124,958
|
8
|
|
Central Croatia, municipality, HMR < 120 square meters
|
150
|
4
|
59
|
4
|
96,573
|
6
|
|
City of Zagreb, HMR < 120 square meters
|
830
|
21
|
133
|
10
|
279,420
|
19
|
|
Eastern Croatia, city, HMR < 120 square meters
|
485
|
12
|
229
|
17
|
230,580
|
15
|
|
Eastern Croatia, municipality, HMR < 120 square meters
|
225
|
6
|
128
|
9
|
140,397
|
9
|
|
Adriatic Coast, city, HMR < 120 square meters
|
480
|
12
|
158
|
12
|
232,817
|
16
|
|
Adriatic Coast, municipality, HMR < 120 square meters
|
230
|
6
|
64
|
5
|
128,137
|
9
|
|
Cities of Split and Rijeka, HMR < 120 square meters
|
380
|
10
|
103
|
8
|
111,113
|
7
|
|
Central Croatia, city, HMR >
120 square meters
|
155
|
4
|
63
|
5
|
26,420
|
2
|
|
Central Croatia, municipality, HMR > 120 square meters
|
100
|
3
|
52
|
4
|
19,602
|
1
|
|
City of Zagreb, HMR > 120
square meters
|
195
|
5
|
60
|
4
|
20,557
|
1
|
|
Eastern Croatia, city, HMR >
120 square meters
|
225
|
6
|
125
|
9
|
33,039
|
2
|
|
Eastern Croatia, municipality, HMR
> 120 square meters
|
95
|
2
|
50
|
4
|
18,635
|
1
|
|
Adriatic Coast, city, HMR >120
square meters
|
115
|
3
|
28
|
2
|
17,641
|
1
|
|
Adriatic Coast, municipality, HMR
> 120 square meters
|
85
|
2
|
21
|
2
|
14,064
|
1
|
|
Cities of Split and Rijeka, HMR
> 120 square meters
|
30
|
1
|
10
|
1
|
2,605
|
0,2
|
|
TOTAL
|
4000
|
100
|
1357
|
100
|
1,496,558
|
100
|
Note: Geographical location “Adriatic Coast” includes the following counties: Primorje-Gorski Kotar, Lika-Senj, Zadar, Šibenik-Knin, Split-Dalmatia, Istria and Dubrovnik-Neretva. Geographical location “Eastern Croatia” includes the following counties: Sisak-Moslavina, Karlovac, Bjelovar-Bilogora, Virovitica-Podravina, Požega-Slavonia, Brod-Posavina, Osijek-Baranja and Vukovar-Srijem. Geographical location “Central Croatia” includes the following counties: Zagreb, Krapina-Zagorje, Varaždin, Koprivnica-Križevci and Međimurje. Source: ECB and author’s calculations.
|
Components of net assets
|
Share of households, in %
|
Median, in EUR thousands
|
Mean, in EUR thousands
|
Share in total value of
assets/liabilities
|
|
|
|
(1) Real assets
|
94
|
70
|
114
|
97
|
|
|
Main residence (85%)
|
85
|
66
|
94
|
73
|
|
|
Other real estate
|
23
|
20
|
54
|
11
|
|
|
Vehicles
|
69
|
4
|
6
|
4
|
|
|
Other valuables
|
4
|
2
|
6
|
0
|
|
|
Self-employment business assets*
|
5
|
25
|
209
|
9
|
|
|
(2) Financial assets
|
82
|
0.5
|
5
|
3
|
|
|
Sight accounts
|
80
|
0.2
|
9
|
1
|
|
|
Savings accounts
|
14
|
5
|
13
|
2
|
|
|
Voluntary pension funds/ whole life insurance
|
6
|
5
|
6
|
0
|
|
|
Mutual funds
|
1.4
|
3
|
4
|
0
|
|
|
Money owed to household
|
3
|
2
|
6
|
0
|
|
|
Shares
|
5
|
2
|
4
|
0
|
|
|
Bonds
|
0.4
|
0.1
|
69
|
0
|
|
|
Other types of financial assets
|
0.7
|
0
|
0.2
|
0
|
|
|
(3) Liabilities
|
41
|
2
|
10
|
-
|
|
|
Mortgage debt
|
9
|
20
|
30
|
66
|
|
|
for main residence
|
9
|
20
|
30
|
63
|
|
|
for other real estate
|
0.4
|
16
|
26
|
3
|
|
|
Non-mortgage debt
|
36
|
2
|
4
|
34
|
|
|
Credit lines/overdrafts
|
27
|
1
|
1
|
9
|
|
|
Credit card debt
|
6
|
0.4
|
0.8
|
1
|
|
|
Other non-mortgage loans
|
13
|
5
|
8
|
24
|
|
|
(1+2) Gross assets
|
98
|
67
|
111
|
-
|
|
|
((1+2)-3) Net assets
|
100
|
61
|
107
|
-
|
|
Note: *Self-employment business assets means any household-owned component of real assets (real estates, vehicles or valuables) used in running a self-employment business. Gross assets are calculated as the sum of real and financial assets. Net assets equal the amount of gross assets net of household liabilities. Since the survey has been harmonised across EU member states, its values are expressed in euros. Median and means are calculated for the households that own a certain category of assets. Source: ECB and author’s calculations.
Source: ECB and author’s calculations.
Source: ECB and author's calculations.
Source: ECB and author’s calculations.
Source: ECB and author’s calculations.
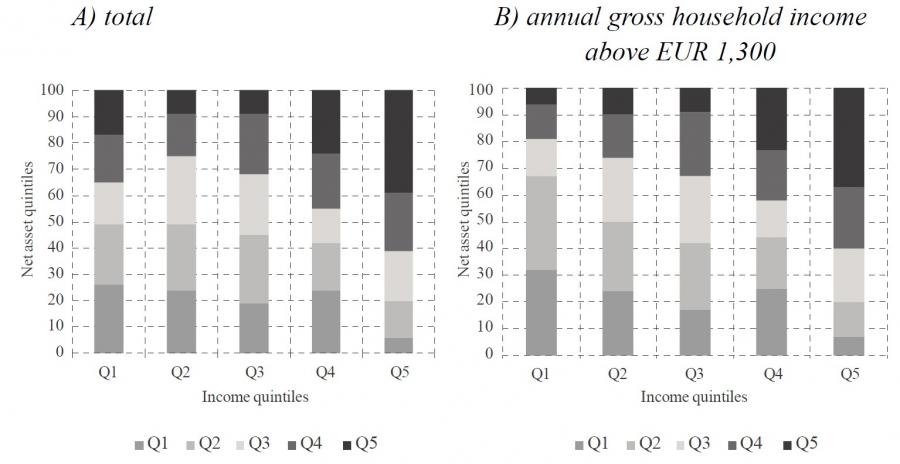 Source: ECB and author’s calculations.
Source: ECB and author’s calculations.
Note: Geographical location “Adriatic Coast” includes the following counties: Primorje-Gorski Kotar, Lika-Senj, Zadar, Šibenik-Knin, Split-Dalmatia, Istria and Dubrovnik-Neretva. Geographical location “Eastern Croatia” includes the following counties: Sisak-Moslavina, Karlovac, Bjelovar-Bilogora, Virovitica-Podravina, Požega-Slavonia, Brod-Posavina, Osijek-Baranja and Vukovar-Srijem. Geographical location “Central Croatia” includes the following counties: Zagreb, Krapina-Zagorje, Varaždin, Koprivnica-Križevci and Međimurje. Source: ECB and author’s calculations.
Note![]() : Geographical location “Adriatic Coast” includes the following counties: Primorje-Gorski Kotar, Lika-Senj, Zadar, Šibenik-Knin, Split-Dalmatia, Istria and Dubrovnik-Neretva. Geographical location “Eastern Croatia” includes the following counties: Sisak-Moslavina, Karlovac, Bjelovar-Bilogora, Virovitica-Podravina, Požega-Slavonia, Brod-Posavina, Osijek-Baranja and Vukovar-Srijem. Geographical location “Central Croatia” includes the following counties: Zagreb, Krapina-Zagorje, Varaždin, Koprivnica-Križevci and Međimurje. Source: ECB and author’s calculations.
|
|
|
Net asset quntiles
|
|
|
|
1
|
2
|
3
|
4
|
5
|
|
Income per quintiles
|
1
|
0.14***
|
0.14***
|
-0.04
|
-0.05
|
-0.20***
|
|
2
|
0.16***
|
0.13***
|
0.05
|
-0.06
|
-0.28***
|
|
3
|
0.10***
|
0.11***
|
0.01
|
0.00
|
-0.22***
|
|
4
|
0.11***
|
0.05
|
-0.05
|
-0.03
|
-0.08**
|
|
HMR Characteristics
(inheritance and location)
|
Inheritance_HMR
|
-0.11***
|
0.07***
|
0.05*
|
0.01
|
-0.02
|
|
HMR_City of Zagreb
|
0.00
|
-0.21***
|
-0.05
|
0.07*
|
0.19***
|
|
HMR_Primorje
|
0.02
|
-0.24***
|
-0.06**
|
0.09***
|
0.18***
|
|
HMR_Central Croatia
|
0.00
|
-0.03
|
-0.08***
|
0.03
|
0.08***
|
|
Socio-demographic
characteristics of reference person
|
Sex (male)
|
-0.02
|
0.04*
|
-0.03
|
-0.02
|
0.02
|
|
Retirement
|
-0.01
|
-0.09**
|
0.02
|
0.00
|
0.09***
|
|
Unemployed/non-active
|
0.05
|
0.02
|
-0.06
|
-0.01
|
0.00
|
|
Self-employed
|
-0.24***
|
0.06
|
-0.14
|
0.08
|
0.24***
|
|
Secondary education
|
-0.14***
|
-0.06
|
0.03
|
0.06
|
0.12*
|
|
Higher education
|
-0.19***
|
0.13**
|
0.05
|
0.08
|
0.20***
|
|
35-45 age group
|
-0.13***
|
-0.01
|
0.04
|
0.05
|
0.05
|
|
45-64 age group
|
-0.18***
|
0.00
|
0.07
|
0.01
|
0.11**
|
|
65+ age group
|
-0.27***
|
0.07
|
0.04
|
0.05
|
0.12**
|
|
Household characteristics
|
Number of children in household
|
0.05***
|
0.02
|
0.00
|
-0.05***
|
-0.01
|
|
Number of household members
|
-0.03***
|
-0.02*
|
0.00
|
0.03**
|
0.02*
|
|
Indicators of debt burden
|
Mortgage for HMR
|
-0.08**
|
0.11**
|
0.04
|
-0.02
|
-0.05
|
|
Consumer debt
|
0.07***
|
-0.03
|
-0.03
|
0.03
|
-0.03
|
|
Other characteristics
|
Social benefits recipients
|
0.07**
|
0.02
|
-0.05
|
0.04
|
-0.08*
|
|
Willingness to take risks
|
0.01
|
-0.08
|
-0.06
|
0.02
|
0.10**
|
* Generalized ordered probit model, marginal effects Note: Symbols ***, ** and * indicate statistical significance of 99%, 95% and 90% respectively. Reference categories: for income – Income_5quintile group for the HMR location – _HMR location Eastern Croatia; for labour market status – Employed; for educational attainment – Primary education or no education, for age – Up to 34 years of age. Source: ECB and author’s calculations.
|
Information on the reference person
|
HFCS
|
EU SILC
|
|
Education
|
Primary
|
24
|
26
|
|
Secondary
|
59
|
57
|
|
Higher
|
16
|
17
|
|
Age
|
Under 24
|
25
|
26
|
|
25-54
|
37
|
41
|
|
55-64
|
17
|
14
|
|
65+
|
21
|
19
|
|
Labour market status
|
Employed
|
45
|
38
|
|
Self-employed
|
3
|
4
|
|
Retirement
|
42
|
31
|
|
Non-active/unemployed
|
9
|
27
|
|
Average household size (no.of individuals)
|
2.8
|
2.8
|
|
Information on main residence
|
|
|
|
|
Owners
|
85
|
90
|
|
Renters
|
15
|
10
|
Note: Information on the reference person for the HFCS was calculated by using the estimated weights and all five versions of data imputations. Information on the reference persons for the EU-SILC was taken from the Eurostat data. Source: ECB and Eurostat (EU SILC).
|
Components of net assets
|
Gini coefficient
|
|
|
|
Real assets
|
0.59
|
|
|
Main residence
|
0.56
|
|
|
Other real estate
|
0.93
|
|
|
Vehicles
|
0.69
|
|
|
Other valuables
|
0.99
|
|
|
Self-employment business assets
|
0.99
|
|
|
Financial assets
|
0.88
|
|
|
Current accounts
|
0.83
|
|
|
Savings accounts
|
0.96
|
|
|
Voluntary pension/life insurance
|
0.99
|
|
|
Mutual funds
|
0.99
|
|
|
Money owed to household
|
0.99
|
|
|
Shares
|
0.98
|
|
|
Bonds
|
0.99
|
|
|
Other types of financial assets
|
0.96
|
|
|
Liabilities
|
0.90
|
|
|
Mortgage debt
|
0.96
|
|
|
Non-mortgage debt
|
0.89
|
|
|
Total annual gross income
|
0.51
|
|
|
Gross assets
|
0.59
|
|
|
Net assets
|
0.61
|
|
Source: ECB and author’s calculations.
|
|
|
Net asset quintiles
|
|
|
|
1
|
2
|
3
|
4
|
5
|
|
Income per quintiles
(OECD)
|
1
|
0.13***
|
0.13***
|
-0.01
|
-0.06
|
-0.18***
|
|
2
|
0.16***
|
0.12***
|
0.01
|
-0.07*
|
-0.22***
|
|
3
|
0.10***
|
0.10**
|
0.03
|
-0.05
|
-0.18***
|
|
4
|
0.06
|
0.05
|
0.03
|
-0.05
|
-0.10***
|
|
HMR Characteristics
(inheritance and location)
|
Inheritance_HMR
|
-0.11***
|
0.08***
|
0.04*
|
0.01
|
-0.02
|
|
HMR_City of Zagreb
|
0.00
|
-0.22***
|
-0.04
|
0,06*
|
0.21***
|
|
HMR_Primorje
|
0.03
|
-0.24***
|
-0.07***
|
0.09***
|
0.18***
|
|
HMR_Central Croatia
|
0.00
|
-0.03
|
-0.08**
|
0.02
|
0.08***
|
|
Socio-demographic
characteristics of reference person
|
Sex (male)
|
-0.01
|
0.04*
|
-0.03
|
-0.02
|
0.02
|
|
Retirement
|
-0.02
|
-0.08*
|
0.02
|
0.01
|
0.08**
|
|
Unemployed/non-active
|
0.04
|
0.03
|
-0.05
|
-0.01
|
-0.01
|
|
Self-employed
|
-0.26***
|
0.06
|
-0.11
|
0.08
|
0.23***
|
|
Secondary education
|
-0.14***
|
-0.06
|
0.03
|
0.06
|
0.10
|
|
Higher education
|
-0.17***
|
-0.11**
|
0.03
|
0.07
|
0.18***
|
|
35-45 age group
|
-0.13***
|
-0.02
|
0.04
|
0.05
|
0.06
|
|
45-64 age group
|
-0.18***
|
-0.01
|
0.06
|
0.01
|
0.12**
|
|
65+ age group
|
-0.27***
|
0.06
|
0.04
|
0.05
|
0.13**
|
|
Household characteristics
|
Number of children in household
|
0.05***
|
0.03
|
-0.01
|
-0.05***
|
-0.02
|
|
Number of household members
|
-0.04***
|
-0.03***
|
0.00
|
0.03***
|
0.05***
|
|
Indicators of debt burden
|
Mortgage for HMR
|
-0.08*
|
0.10**
|
0.05
|
-0.03
|
-0.06
|
|
Consumer debt
|
0.07***
|
-0.02
|
-0.04*
|
0.03
|
-0.03
|
|
Other characteristics
|
Social benefits recipients
|
0.07**
|
0.02
|
-0.05
|
0.03
|
-0.07*
|
|
Willingness to take risks
|
0.02
|
-0.07
|
-0.05
|
0.01
|
0.09*
|
Note: Symbols ***, ** and * indicate statistical significance of 99%, 95% and 90% respectively. Reference categories: for income – Income_5quntile group for the HMR location – _HMR location Eastern Croatia; for labour market status – Employed; for educational attainment – Primary education or no education, for age – Up to 34 years of age. Source: ECB and author’s calculations.
|
|
|
Net asset quintiles
|
|
|
|
1
|
2
|
3
|
4
|
5
|
|
Income per quintiles >
EUR 1,300
|
1
|
0.28***
|
0.07
|
-0.01
|
-0.08
|
-0.26***
|
|
2
|
0.18***
|
0.06
|
-0.03
|
-0.03
|
-0.25***
|
|
3
|
0.14***
|
0.09**
|
-0.01
|
-0.04
|
-0.18***
|
|
4
|
0.13***
|
0.02
|
-0.05
|
-0.02
|
-0.09*
|
|
HMR Characteristics
(inheritance and location)
|
Inheritance_HMR
|
-0.15***
|
0.12***
|
0.04
|
0.00
|
-0.02
|
|
HMR_City of Zagreb
|
0.05
|
-0.25***
|
-0.06
|
0.06*
|
0.20***
|
|
HMR_Primorje
|
0.04
|
-0.27***
|
-0.06*
|
0.11***
|
0.18***
|
|
HMR_Central Croatia
|
0.00
|
-0.04
|
-0.08**
|
0.06*
|
0.06**
|
|
Socio-demographic
characteristics of reference person
|
Sex (male)
|
-0.01
|
0.04
|
-0.03
|
-0.03
|
0.02
|
|
Retirement
|
-0.02
|
-0.03
|
-0.01
|
-0.01
|
0.08**
|
|
Unemployed/non-active
|
0.01
|
0.02
|
-0.01
|
0.00
|
-0.01
|
|
Self-employed
|
-0.97
|
0.79
|
-0.11
|
0.04
|
0.25***
|
|
Secondary education
|
-0.13***
|
-0.08
|
0.05
|
0.01
|
0.15
|
|
Higher education
|
-0.12**
|
-0.20***
|
0.08
|
0.02
|
0.22*
|
|
35-45 age group
|
-0.16***
|
0.06
|
0.00
|
0.04
|
0.06
|
|
45-64 age group
|
-0.20***
|
0.02
|
0.04
|
0.03
|
0.12**
|
|
65+ age group
|
-0.32***
|
0.11*
|
0.03
|
0.05
|
0.13**
|
|
Household characteristics
|
Number of children in household
|
0.04**
|
0.04*
|
-0.01
|
-0.05**
|
-0.02
|
|
Number of household members
|
-0.02
|
-0.04**
|
0.00
|
0.03**
|
0.02*
|
|
Indicators of debt burden
|
Mortgage for HMR
|
-0.07*
|
0.14***
|
0.03
|
-0.04
|
-0.06
|
|
Consumer debt
|
0.08***
|
-0.04
|
-0.03
|
0.02
|
-0.03
|
|
Other characteristics
|
Social benefits recipients
|
0.07**
|
0.03
|
-0.08*
|
0.05
|
-0.07
|
|
Willingness to take risks
|
-0.04
|
-0.07
|
-0.03
|
0.06
|
0.08
|
* Generalized ordered probit model, marginal effects, sample excludes the households that reported annual gross income lower than EUR 1,300 and the accompanying income and net asset quintiles modified accordingly Note: Symbols ***, ** and * indicate statistical significance of 99%, 95% and 90% respectively. Reference categories: for income – Income_5quntile group for the HMR location – _HMR location Eastern Croatia; for labour market status – Employed; for educational attainment – Primary education or no education, for age – Up to 34 years of age. Source: ECB and author’s calculations.
|
|
|
OLS
(Model 1)
|
OLS
(Model 2)
|
Ordered probit model
(Model 3)
|
|
Income per quintiles
(OECD)
|
1
|
-0.78***
|
|
-0.71***
|
|
2
|
-1.16***
|
|
-0.88***
|
|
3
|
-0.69***
|
|
-0.64***
|
|
4
|
-0.41**
|
|
-0.39***
|
|
|
log (annual gross income)
|
|
-0.39***
|
|
|
|
log (annual gross income)^2
|
|
0.04***
|
|
|
HMR Characteristics
(inheritance and location)
|
Inheritance_HMR
|
0.55***
|
0.55***
|
0.15**
|
|
HMR_City of Zagreb
|
0.50**
|
0.54***
|
0.61***
|
|
HMR_Primorje
|
0.38**
|
0.40**
|
0.53***
|
|
HMR_Central Croatia
|
0.23
|
0.24
|
0.15*
|
|
Socio-demographic
characteristics of reference person
|
Sex (male)
|
0.06
|
0.07
|
0.03
|
|
Retirement
|
0.48**
|
0.23
|
0.29***
|
|
Unemployed/non-active
|
-0.45**
|
-0.42*
|
-0.12
|
|
Self-employed
|
1.03***
|
1.02***
|
0.97***
|
|
Secondary education
|
0.59**
|
0.77***
|
0.50***
|
|
Higher education
|
0.81**
|
1.03***
|
0.75***
|
|
35-45 age group
|
0.75***
|
|
0.48***
|
|
45-64 age group
|
0.97***
|
|
0.69***
|
|
65+ age group
|
1.06***
|
|
0.81***
|
|
|
log (age)
|
|
1.21***
|
|
|
Household characteristics
|
Number of children in household
|
-0.27**
|
-0.25**
|
-0.18***
|
|
Number of household members
|
0.33***
|
0.26***
|
0.22***
|
|
Indicators of debt burden
|
Mortgage for HMR
|
0.24
|
0.24
|
0.02
|
|
Consumer debt
|
0.15
|
0.18
|
-0.17**
|
|
Other characteristics
|
Social benefits recipients
|
-0.57**
|
-0.52**
|
-0.23**
|
|
Willingness to take risks
|
0.37
|
0.54*
|
0.16
|
|
|
Constant
|
8.44
|
3.96
|
|
|
Wald thest for homogeneity of coefficients
|
chi2
|
|
|
219.84
|
|
Prob>chi2
|
|
|
0.000
|
Note: The Model 2 of the least squares estimator includes the income square due to the non-linear effect of income. The Model 3 is an ordered probit model (homogeneous coefficient for different categories of the dependent variable). The results of the Model 3 show the estimated model coefficients rather than marginal effects. The Table also shows the results of the Wald test that rejects the homogeneity assumption (parallel line assumption test). Source: ECB and author’s calculations.
Arrondel, L., Roger, M. and Savignac, F., 2014. Wealth and income in the euro area Heterogenity in households' behaviour. ECB Working Paper, No. 1709.
Auclert, A., 2017. Monetary policy and the redistributional channel. NBER Working Paper, No. 23451 [ CrossRef]
Boes, S., 2006. REGOPROB: Stata module to estimate random effects generalized ordered probit models. Statistical Software Components S456604. Boston: Boston College Department of Economics.
CBS, 2017. Statistics on Income and Living Conditions (SILC), 2016 Indicators of Poverty and Social Exclusion in 2016. Zagreb: Croatian Bureau of Statistics.
Christiaensen, L. [et al.], 2019. Jobs Challenges in Slavonia, Croatia – A Subnational Labor Market Assessment. World Bank Group, Jobs Working Paper No. 35 [ CrossRef]
Fessler, P. and Schürz, M., 2015. Private Wealth across European Countries: The role of income, Inheritance and the Welfare State. ECB Working Paper, No. 1847.
Fessler, P., Linder, P. and Segalla, E., 2014. Net Wealth Across the Euro Area –Why Household Structure Matters and How to Control for It. ECB Working Paper, No. 1663.
Green, W. and Hensher, D., 2010. Modeling Ordered Choices. New York: Cambridge University Press [ CrossRef]
Herceg, I. and Nestić, D., 2014. A New Cluster-Based Financial Vulnerability Indicator and Its Application to Household Stress Testing in Croatia. Emerging markets finance and trade, 50(5), pp. 60-77 [ CrossRef]
Herceg, I. and Šošić, V., 2011. The Anatomy of Household in Croatia: Enlisting More Creditworthy Households or Relaxing Lending Standards? Comparative Economic Studies, 53, pp. 199-221 [ CrossRef]
Jappelli, T., 1995. Does social security reduce the accumulation of private wealth? Evidence from Italian survey data. Ricerche Economiche, 49, pp. 1-31 [ CrossRef]
Jemrić, I. and Vrbanc, I., 2019. Anketa o financiranju i potrošnji kućanstava. In preparation.
Kontbay-Busun, S. and Peichl, A., 2015. Multidimensional Affluence in Income and Wealth in the Eurozone: A Cross-Country Comparison Using the HFCS. IZA Discussion Paper, No. 9139 [ CrossRef]
Lise, J., 2011. On-the-Job Search and Precautionary Savings: Theory and Empirics of Earnings and Wealth Inequality. Institute for Fiscal Studies, WP 11-2016 [ CrossRef]
Maestri, V., Bogliacino, F. and Salverda, W., 2014. Wealth Inequality and the Accumulation of Debt. In: W. Salverda [et al.]. Changing Inequalities in Rich Countries: Analytical and Comparative Perspectives [ CrossRef]
Mathä, T. J., Porpiglia, A. and Ziegelmeyer, M., 2014. Household wealth in the euro area: The importance of intergenerational transfers, home ownership and house price dynamics. ECB Working Paper, 1690 [ CrossRef]
Merikull, J. and Room, T., 2016. The assets, liabilities and wealth of Estonian households: Results of the Household Finance and Consumption Survey. Eesti Pank, Occasional Paper, 3-2016 [ CrossRef]
Modigliani, F. and Brumberg, R., 1954. Utility analysis and the Consumption Function: an Interpretation of Cross-section Data. In: K. Kurihara. Post-Keynesian Economics. New Brunswick: Rutgers University Press, pp. 388-436.
Piketty, T., 2011. On the Long-Run Evolution of Inheritance: France 1820 - 2050. The Quarterly Journal of Economics, 3(126), pp. 1071-1131 [ CrossRef]
Rosan, M. and Zauder K., 2019. A Micro-level Analysis of Croatian Households' Debt Participation. In preparation.
Rubil, I., 2013. Razlike u siromaštvu na razini regija u Hrvatskoj: uloga razlika u prosječnim dohocima i nejednakostima distribucije dohodaka. Radni materijali EIZ-a, No. 1.
Rubil, I., Stubbs, P. and Zrinščak, S., 2018. Child Poverty and Household Coping Strategies in Croatia: A Quantitative-Qualitative Study. Privredna kretanja i ekonomska politika, 26(2) (141), pp. 59 – 116 [ CrossRef]
Sierminska, E. and Medgyesi M., 2013. The distribution of wealth between households. European Commission Research Note, 11.
Sierminska, E., Frick J. R. and Grabka, M. M., 2010. Examining the gender wealth gap. Oxford Economic Papers, 62(4), pp. 669-690 [ CrossRef]
Tzamourani, P., 2019. The interest rate exposure of euro area households. Deutsche Bundesbank Discussion Paper, No. 1-2019 [ CrossRef]
Williams, R., 2006. Generalized Ordered Logit/partial Proportional Odds Models for Ordinal Dependent Variables. The Stata Journal, 6, pp. 58-82 [ CrossRef]
Zakon o prodaji stanova nad kojima postoji stanarsko pravo, NN 27/91. Zagreb: Narodne novine.
Zakon o socijalnoj skrbi, NN 152/14. Zagreb: Narodne novine.
|
|
September, 2020
III/2020
|





