4646
Views
1178
Downloads |
Penny wise and pound foolish: capital gains tax and trading volume on the Zagreb Stock Exchange
Tomislav Globan*
 Tomislav Globan
Affiliation:
Tomislav Globan
Affiliation: Faculty of Economics & Business, University of Zagreb, Zagreb, Croatia
 0000-0001-5716-2113 0000-0001-5716-2113
Tihana Škrinjarić* 
Article | Year: 2020 | Pages: 299 - 329 | Volume: 44 | Issue: 3 Received: June 1, 2019 | Accepted: February 9, 2020 | Published online: September 1, 2020
|

FULL ARTICLE
FIGURES & DATA
REFERENCES
CROSSMARK POLICY
METRICS
LICENCING
PDF
Source: Authors’ estimations.
Source: Authors’ estimations.
Source: Authors’ estimations.
|
Day
|
Sign test
|
|
Normal
approximation
|
Exact
binomial
|
|
-10
|
1.17
|
(0.243)
|
28
|
(0.243)
|
|
-9
|
1.75*
|
(0.080)
|
30*
|
(0.079)
|
|
-8
|
2.63***
|
(0.009)
|
33***
|
(0.008)
|
|
-7
|
2.33**
|
(0.020)
|
32**
|
(0.019)
|
|
-6
|
2.33**
|
(0.020)
|
32**
|
(0.019)
|
|
-5
|
3.21***
|
(0.001)
|
35***
|
(0.001)
|
|
-4
|
2.63***
|
(0.009)
|
33***
|
(0.008)
|
|
-3
|
2.33**
|
(0.020)
|
32**
|
(0.019)
|
|
-2
|
2.63***
|
(0.009)
|
33***
|
(0.008)
|
|
-1
|
2.63***
|
(0.009)
|
33***
|
(0.008)
|
|
0
|
2.33**
|
(0.020)
|
32**
|
(0.019)
|
|
1
|
3.21***
|
(0.001)
|
35***
|
(0.001)
|
|
2
|
2.63***
|
(0.009)
|
33***
|
(0.008)
|
|
3
|
1.46
|
(0.145)
|
29
|
(0.144)
|
|
4
|
2.63***
|
(0.009)
|
33***
|
(0.008)
|
|
5
|
1.75*
|
(0.080)
|
30*
|
(0.079)
|
|
6
|
2.63***
|
(0.009)
|
33***
|
(0.008)
|
|
7
|
2.63***
|
(0.009)
|
33***
|
(0.008)
|
|
8
|
2.04**
|
(0.041)
|
31**
|
(0.040)
|
|
9
|
2.04**
|
(0.041)
|
31**
|
(0.040)
|
|
10
|
1.75*
|
(0.080)
|
30*
|
(0.079)
|
Note: ***p<0.01, **p<0.05, *p<0.1. p-values in parentheses. Source: Authors’ estimations.
Source: Authors’ estimations.
|
|
(1)
|
(2)
|
(3)
|
(4)
|
|
Polynomial order
|
p=4
|
p=3
|
p=2
|
p=1
|
|
Estimator
|
|
|
|
|
|
Conventional
|
-0.667**
|
-0.505**
|
-0.362*
|
-0.251
|
|
(0.320)
|
(0.249)
|
(0.219)
|
(0.169)
|
|
Bias-corrected
|
-0.719**
|
-0.536**
|
-0.411*
|
-0.309*
|
|
(0.320)
|
(0.249)
|
(0.219)
|
(0.169)
|
|
Robust std. errors
|
-0.719**
|
-0.536*
|
-0.411*
|
-0.309
|
|
(0.350)
|
(0.276)
|
(0.248)
|
(0.196)
|
|
Number of
obs.
|
|
|
|
|
|
Total
|
3096
|
3096
|
3096
|
3096
|
|
Left of the cut-off
|
1574
|
1574
|
1574
|
1574
|
|
Right of the cut-off
|
1522
|
1522
|
1522
|
1522
|
Note: ***p<0.01, **p<0.05, *p<0.1. Standard errors in parentheses. Source: Authors’ estimations.
|
|
(1)
|
(2)
|
(3)
|
(4)
|
(5)
|
(6)
|
|
|
Panel EGLS (cross-section weights)
|
Panel least squares (no weights)
|
|
Dependent variable (volume)
|
growth rate
|
log
|
in HRK
|
growth rate
|
log
|
in HRK
|
|
volume(-1)
|
-0.437***
(0.018)
|
0.443***
(0.024)
|
0.284***
(0.029)
|
-0.442***
(0.022)
|
0.444***
(0.024)
|
0.069*
(0.037)
|
|
tax
|
-0.446***
(0.097)
|
-0.458***
(0.113)
|
-27,961.4***
(8,468.0)
|
-0.497***
(0.094)
|
-0.489***
(0.113)
|
-26,445.0
(20,793.4)
|
|
pretax
|
0.164***
(0.038)
|
0.188***
(0.033)
|
5,987.7***
(2,244.3)
|
0.139***
(0.040)
|
0.160***
(0.033)
|
-32,576.2*
(17,940.9)
|
|
aftertax
|
-0.001
(0.053)
|
-0.078
(0.049)
|
232.0
(3,390.7)
|
0.009
(0.055)
|
-0.063
(0.049)
|
34,853.7
(36,126.9)
|
|
stdev
|
0.032***
(0.011)
|
0.004
(0.113)
|
313.56
(574.83)
|
0.018*
(0.011)
|
-0.006
(0.010)
|
-3,060.3
(5,914.17)
|
|
return
|
0.061***
(0.021)
|
0.049***
(0.019)
|
1,252.41
(813.42)
|
0.054**
(0.022)
|
0.039**
(0.018)
|
11,519.3
(7,654.1)
|
|
january
|
0.102*
(0.104)
|
0.073
(0.122)
|
12,781.6
(8,840.2)
|
0.144
(0.102)
|
0.104
(0.122)
|
-19,739.5
(23,000.9)
|
|
constant
|
-0.062
(0.047)
|
6.386***
(0.276)
|
220,956***
(8,692.0)
|
-0.063
(0.047)
|
6.395***
(0.281)
|
281,382***
(25,462.2)
|
|
R-squared
|
0.204
|
0.774
|
0.443
|
0.206
|
0.713
|
0.262
|
|
Adj. R-sq.
|
0.190
|
0.770
|
0.434
|
0.192
|
0.708
|
0.249
|
|
No. of observ.
|
3005
|
3019
|
3019
|
3005
|
3019
|
3019
|
|
Notes: ***p<0.01, **p<0.05, *p<0.1.
Standard errors in parentheses.
Source: authors’ estimations
|
Notes: ***p<0.01, **p<0.05, *p<0.1. Standard errors in parentheses. Source: authors’ estimations
|
VARIABLE (volume)
|
(1)
|
(2)
|
(3)
|
|
Croatia post-2015:M12
|
-0.663*
|
-0.233**
|
-0.270*
|
|
(0.343)
|
(0.110)
|
(0.161)
|
|
Stock market return
|
|
0.201*
|
0.356**
|
|
|
(0.111)
|
(0.147)
|
|
Stock market volatility
|
|
0.345***
|
0.407***
|
|
|
(0.090)
|
(0.123)
|
|
Interest rate
|
|
0.012
|
0.045
|
|
|
(0.026)
|
(0.035)
|
|
Growth in money supply
|
|
-0.021
|
-0.011
|
|
|
(0.042)
|
(0.052)
|
|
Exchange rate volatility
|
|
0.009
|
0.032
|
|
|
(0.069)
|
(0.091)
|
|
Constant
|
|
17.683***
|
17.513***
|
|
|
(0.099)
|
(0.141)
|
|
R-squared
|
0.110
|
0.277
|
0.218
|
Notes: Treated observations are trading volumes of Croatian stocks after the capital gains tax was introduced. Control group consists of Bulgaria, Czech Republic, Hungary, Poland, and Romania. Model (3) excludes the period after 2016:M12 to exclude the effect of the Agrokor crisis. Standard errors in parentheses. ***p<0.01, **p<0.05, *p<0.1 Source: authors’ estimations
Source: Authors’ estimations.
|
|
(7)
|
(8)
|
(9)
|
(10)
|
(11)
|
(12)
|
|
|
Panel EGLS (cross-section weights)
|
Panel least squares (no weights)
|
|
Dependent variable (volume)
|
growth rate
|
log
|
in HRK
|
growth rate
|
log
|
in HRK
|
|
Volume (-1)
|
-0.444***
(0.021)
|
0.372***
(0.025)
|
0.221***
(0.026)
|
-0.453***
(0.024)
|
0.377***
(0.027)
|
0.089*
(0.047)
|
|
tax
|
-0.490***
(0.054)
|
-0.451***
(0.061)
|
-32,218.6***
(5,794.3)
|
-0.554***
(0.028)
|
-0.510***
(0.059)
|
-34,607.8**
(16,564.0)
|
|
pretax
|
0.169***
(0.040)
|
0.182***
(0.033)
|
7,020.49**
(2,847.7)
|
0.150***
(0.041)
|
0.156***
(0.033)
|
-36,844.9*
(19,617.5)
|
|
aftertax
|
0.056
(0.067)
|
-0.028
(0.059)
|
2,165.3
(4,069.4)
|
0.082
(0.072)
|
0.037
(0.061)
|
60,357.4
(65,500.3)
|
|
stdev
|
0.095***
(0.017)
|
0.057***
(0.016)
|
3,699.25***
(1,175.51)
|
0.066***
(0.017)
|
0.032**
(0.016)
|
3,059.2
(13,840.0)
|
|
return
|
0.084***
(0.026)
|
0.078***
(0.022)
|
3,847.8***
(1,386.9)
|
0.058**
(0.024)
|
0.045**
(0.021)
|
32,604.4**
(13,406.9)
|
|
january
|
0.176***
(0.065)
|
0.101
(0.068)
|
13,091.4**
(6,238.3)
|
0.205***
(0.047)
|
0.122*
(0.066)
|
-13,823.8
(23,534.1)
|
|
constant
|
-0.239***
(0.058)
|
7.084***
(0.292)
|
23,7926***
(8,616.2)
|
-0.176***
(0.058)
|
7.069***
(0.314)
|
26,8943***
(44,069.2)
|
|
R-squared
|
0.229
|
0.797
|
0.487
|
0.226
|
0.717
|
0.268
|
|
Adj. R-squared
|
0.210
|
0.792
|
0.474
|
0.206
|
0.710
|
0.249
|
|
No. of observ.
|
2060
|
2065
|
2065
|
2060
|
2065
|
2065
|
Notes: ***p<0.01, **p<0.05, *p<0.1. Standard errors in parentheses. Source: Authors’ estimations.
|
Abbreviation
|
Full name
|
Abbreviation
|
Full name
|
|
ADPL
|
AD Plastik
|
KOEI
|
Končar
elektroindustrija
|
|
ADRS
|
Adris Grupa
|
KRAS
|
Kraš
|
|
ADRS2
|
Adris Grupa
|
LEDO
|
Ledo
|
|
ARNT
|
Arenahospitality
Group
|
LKPC
|
Luka Ploče
|
|
ATGR
|
Atlantic
Grupa
|
LRH
|
Liburnia Riviera Hoteli
|
|
ATLN
|
Excelsa
Nekretnine
|
MAIS
|
Maistra
|
|
ATPL
|
Atlanska
Plovidba
|
OPTE
|
Ot-Optima
Telekom
|
|
BD62
|
Badel 1862
|
PBZ
|
Privredna Banka Zagreb
|
|
DDJH
|
Đuro Đaković
Grupa
|
PLAG
|
Plava Laguna
|
|
DLKV
|
Dalekovod
|
PODR
|
Podravka
|
|
ERNT
|
Ericsson
Nikola Tesla
|
PTKM
|
Petrokemija
|
|
HIMR
|
Imeprial
Hotelijerstvo
|
RIVP
|
Valamar
Riviera
|
|
HMST
|
Hoteli Maestral
|
RIZO
|
Riz-Odašiljači
|
|
HT
|
Hrvatski
Telekom
|
SUNH
|
Sunčani Hvar
|
|
HTKP
|
Htp Korčula
|
THNK
|
Tehnika
|
|
HUPZ
|
Hup Zagreb
|
TPNG
|
Tankerska
Next Generation
|
|
IGH
|
Institut IGH
|
TUHO
|
Turisthotel
|
|
INA
|
Ina
|
ULPL
|
Uljanik
Plovidba
|
|
INGR
|
Ingra
|
VART
|
Varteks
|
|
IPKK
|
Termes Grupa
|
VDKT
|
Viadukt
|
|
JMNC
|
Jamnica
|
VERN
|
Genera
|
|
JNAF
|
Jadranski
Naftovod
|
ZABA
|
Zagrebačka
Banka
|
|
KODT
|
Končar transformatori
|
|
|
|
Stock
|
Volume – monthly series
|
Volume – daily series
|
|
In thousands
|
|
In thousands
|
|
T
|
Mean
|
Max
|
Min
|
Std Dev
|
T
|
Mean
|
Max
|
Min
|
Std Dev
|
|
ADPL
|
137
|
267.75
|
1,053.45
|
26.89
|
216.88
|
244
|
123.63
|
1,567.48
|
0.29
|
212.86
|
|
ADRS
|
137
|
338.98
|
4,990.79
|
10.13
|
479.49
|
210
|
483.92
|
12,017.97
|
0.52
|
1,164.48
|
|
ADRS2
|
137
|
1,040.93
|
8,546.29
|
191.83
|
990.20
|
267
|
1,230.45
|
10,257.70
|
6.02
|
1,385.18
|
|
ARNT
|
137
|
116.35
|
999.37
|
3,291.37
|
150.59
|
226
|
72.13
|
697.17
|
0.33
|
88.08
|
|
ATGR
|
137
|
415.06
|
2,704.10
|
43.49
|
413.64
|
261
|
359.35
|
12,294.00
|
0.82
|
1,061.10
|
|
ATLN
|
137
|
23.16
|
169.46
|
2,291.80
|
19.43
|
160
|
28.79
|
299.33
|
0.09
|
38.92
|
|
ATPL
|
137
|
1,182.02
|
11,737.10
|
34.81
|
2,234.49
|
255
|
101.23
|
856.16
|
0.57
|
140.10
|
|
BD62
|
137
|
32.95
|
334.56
|
2,168.67
|
50.05
|
112
|
29.53
|
452.56
|
0.01
|
71.99
|
|
DDJH
|
137
|
205.45
|
1,707.93
|
11.25
|
223.84
|
267
|
148.16
|
1,127.95
|
0.03
|
199.05
|
|
DLKV
|
137
|
658.26
|
3,806.65
|
11.16
|
921.73
|
259
|
145.05
|
1,884.55
|
1.13
|
213.69
|
|
ERNT
|
137
|
730.53
|
8,319.04
|
64.62
|
1,141.86
|
265
|
311.94
|
6,703.40
|
4.68
|
567.35
|
|
HIMR
|
132
|
82.77
|
2,641.55
|
1.65
|
250.76
|
143
|
95.56
|
7,418.40
|
0.40
|
534.32
|
|
HMST
|
118
|
41.36
|
404.98
|
1.35
|
62.07
|
135
|
50.84
|
907.15
|
0.21
|
96.95
|
|
HT
|
137
|
3,458.93
|
16,686.34
|
497.06
|
3,247.30
|
267
|
1,428.45
|
7,246.07
|
146.63
|
1,211.95
|
|
HTKP
|
137
|
322.17
|
4,367.23
|
1.40
|
644.38
|
58
|
14.84
|
229.30
|
0.06
|
32.62
|
|
HUPZ
|
133
|
2,590.00
|
25,767.94
|
107.36
|
4,021.53
|
122
|
87.22
|
2,408.00
|
1.72
|
249.64
|
|
IGH
|
137
|
663.28
|
6,975.49
|
3,531.91
|
1,405.50
|
143
|
19.49
|
175.94
|
0.09
|
29.89
|
|
INA
|
130
|
1,712.24
|
65,483.06
|
15.10
|
6,606.88
|
196
|
134.43
|
6,471.87
|
2.66
|
454.71
|
|
INGR
|
137
|
507.56
|
4,658.47
|
6,427.43
|
830.21
|
222
|
53.62
|
978.09
|
0.03
|
122.86
|
|
IPKK
|
136
|
63.42
|
830.74
|
5,908.33
|
130.48
|
59
|
27.36
|
1,088.35
|
0.08
|
109.47
|
|
JMNC
|
113
|
619.07
|
25,080.00
|
31.58
|
2,495.54
|
35
|
705.41
|
11,025.00
|
85.50
|
1,363.60
|
|
JNAF
|
137
|
127.84
|
1,044.36
|
10.13
|
161.74
|
88
|
191.39
|
4,783.23
|
3.35
|
591.25
|
|
KODT
|
137
|
75.43
|
1,616.32
|
7,158.87
|
149.30
|
77
|
172.85
|
14,400.00
|
1.11
|
1,247.46
|
|
KOEI
|
137
|
436.93
|
4,127.71
|
34.76
|
555.59
|
201
|
259.15
|
14,719.90
|
0.67
|
1,159.17
|
|
KRAS
|
137
|
118.70
|
473.32
|
19.35
|
84.14
|
253
|
152.63
|
1,164.25
|
2.30
|
202.21
|
|
LEDO
|
116
|
555.80
|
6,570.51
|
36.87
|
778.98
|
164
|
637.45
|
14,962.34
|
7.73
|
1,737.54
|
|
LKPC
|
137
|
188.41
|
2,882.99
|
5.45
|
321.29
|
189
|
119.98
|
8,994.87
|
0.62
|
624.03
|
|
LRH
|
137
|
94.50
|
608.64
|
5,691.94
|
108.09
|
142
|
91.51
|
744.68
|
3.27
|
123.77
|
|
MAIS
|
137
|
56.59
|
400.06
|
2,105.70
|
67.25
|
209
|
61.19
|
401.85
|
0.14
|
73.53
|
|
OPTE
|
137
|
65.74
|
692.44
|
2,104.67
|
115.49
|
230
|
60.61
|
1,561.05
|
0.00
|
129.44
|
|
PBZ
|
137
|
163.91
|
2,473.85
|
3,197.20
|
290.03
|
129
|
115.87
|
2,073.68
|
0.55
|
302.72
|
|
PLAG
|
136
|
109.20
|
2,284.17
|
7.78
|
220.60
|
106
|
118.58
|
1,327.39
|
4.05
|
211.61
|
|
PODR
|
137
|
494.29
|
3,759.51
|
49.03
|
492.02
|
254
|
543.90
|
5,650.90
|
0.91
|
911.76
|
|
PTKM
|
137
|
309.13
|
3,284.68
|
1.22
|
476.12
|
184
|
41.35
|
1,473.83
|
0.07
|
120.80
|
|
RIVP
|
135
|
555.08
|
3,211.42
|
5,263.15
|
645.71
|
267
|
809.06
|
4,414.41
|
42.88
|
792.66
|
|
RIZO
|
112
|
32.00
|
750.82
|
0.05
|
79.32
|
205
|
71.63
|
1,498.57
|
0.09
|
159.69
|
|
SUNH
|
108
|
21.18
|
174.86
|
1.28
|
29.35
|
116
|
30.04
|
815.57
|
0.02
|
87.09
|
|
THNK
|
137
|
124.46
|
932.35
|
1,319.17
|
180.72
|
118
|
28.04
|
201.06
|
0.29
|
35.43
|
|
TPNG
|
52
|
42.90
|
448.85
|
3,452.14
|
83.11
|
213
|
48.60
|
1,448.86
|
0.08
|
170.53
|
|
TUHO
|
137
|
90.55
|
898.46
|
6,566.67
|
108.85
|
84
|
189.01
|
3,906.28
|
2.41
|
493.60
|
|
ULPL
|
137
|
252.91
|
4,197.33
|
3,355.38
|
575.65
|
211
|
25.80
|
190.28
|
0.25
|
29.09
|
|
VART
|
136
|
51.60
|
2,077.46
|
0.90
|
186.44
|
226
|
25.18
|
179.42
|
0.02
|
29.78
|
|
VDKT
|
119
|
154.39
|
1,449.05
|
7,746.58
|
220.92
|
148
|
72.99
|
1,377.11
|
0.23
|
155.84
|
|
VERN
|
98
|
98.54
|
4,272.85
|
2,028.40
|
459.19
|
178
|
77.02
|
815.82
|
0.14
|
122.96
|
|
ZABA
|
137
|
344.38
|
3,533.72
|
25.12
|
439.85
|
223
|
178.38
|
2,063.88
|
0.04
|
303.27
|
|
|
|
Abstract
This paper analyses the effects of a recently introduced capital gains tax on the trading volume on the Zagreb Stock Exchange. Using three different methodological approaches – event study methodology, regression discontinuity design and panel regressions – we offer evidence that the introduction of the capital gains tax in January 2016 created abnormally high trading volume patterns shortly before the tax came into force and abnormally low volume patterns after the fact, further decreasing the liquidity of an already poorly liquid market. The negative effects are significant in both the short and the longer term, as our difference-in-differences estimations suggest that the average trading volume in the three post-tax years decreased by 23% vis-à-vis the pre-tax period. Given that the revenues collected from this tax are almost negligible, but create considerable negative externalities, our main policy recommendation for countries with underdeveloped and not very liquid stock markets is to use less restrictive tax policies to encourage investment and attract as many new investors as possible.
Keywords: capital gains tax; event study; regression discontinuity; stock market; trading volume
JEL: E44, F38, G10
1 Introduction
Earning capital gains is one of the most important drivers of investing. One of the striking findings of recent empirical research in the field of finance was that individual investors tend to sell appreciating stocks too soon and hold on to depreciating stocks for too long (Lei, Zhou and Zhu,  2013; Frazzini, 2006). Tax considerations, however, can significantly impact investors’ behaviour and may alter the aforementioned findings. The literature recognizes two hypotheses that explain why the trading volume significantly changes around specific announcement dates (Karpoff, 1986; Varian, 1989; He and Wang, 1995). The differential interpretation hypothesis states that investors disagree on the distribution of uncertainty after the announcement. On the other hand, the pre-announcement disagreement hypothesis is based upon trading activity induced by disagreement prior to the announcement. The announcement and the implementation of a new tax that affects investment on the stock market is one such event. 2013; Frazzini, 2006). Tax considerations, however, can significantly impact investors’ behaviour and may alter the aforementioned findings. The literature recognizes two hypotheses that explain why the trading volume significantly changes around specific announcement dates (Karpoff, 1986; Varian, 1989; He and Wang, 1995). The differential interpretation hypothesis states that investors disagree on the distribution of uncertainty after the announcement. On the other hand, the pre-announcement disagreement hypothesis is based upon trading activity induced by disagreement prior to the announcement. The announcement and the implementation of a new tax that affects investment on the stock market is one such event.
A key tax that impacts the behaviour of investors on stock markets is the capital gains tax. Researchers have shown that income tax considerations are a major factor in the creation of abnormal trading volumes on the stock market. For instance, Dyl ( 1977) found significant abnormal year-end trading volumes in the United States, especially with stocks that had substantially appreciated or depreciated during the year. This serves as evidence for the existence of tax lock-in strategies utilized by investors to avoid paying capital gains tax, and tax-loss selling strategies to decrease their overall tax burden, respectively.
This paper analyses whether the introduction of a capital gains tax 1 in Croatia affected the trading volume on the Zagreb Stock Exchange (ZSE) before and after the tax came into force on 1 January 2016. Most of the existing literature has focused on analysis of the behaviour of investors at the end of calendar years in which a capital gains tax was already in force. Their aim was to test for evidence of tax lockin and tax-loss strategies, depending on whether certain stocks significantly appreciated or depreciated throughout the calendar year (see e.g. Agostini and Siravegna, 2014; Dyl, 1977; Reese Jr., 1998). Very few researchers, however, have dealt with how the introduction of a capital gains tax affects the overall trading volume on the stock market in countries that have not previously imposed such a tax.
This paper aims to fill this gap and offers innovative insights into the effects of a capital gains tax on investor behaviour before and after the new tax comes into force. We examine the implications of the introduction of new tax policies on trading volume, using both stock-level and country-level data. Utilizing three different methodological approaches – event study methodology (ESM), regression discontinuity design and panel regressions (including difference-in-differences estimations) – we test the hypothesis that the introduction of the capital gains tax created abnormally high trading volume patterns shortly before the tax came into force (to build-up a portfolio of tax-free securities) and abnormally low volume patterns after the fact (because of the new tax burden on newly acquired securities). We hypothesize that the negative effect post-tax is not only short-term, but that it hurt the liquidity of an already poorly liquid market in the longer term as well.
It is important to be aware of the illiquidity of the Croatian stock market (see related literature: Vidović, 2013; Minović, 2012; Vidović, Poklepović and Aljinović, 2014) and how important the liquidity of a market is to (international) investors. Stock market liquidity is an important driver of expected returns in markets such as the Croatian (Bekaert, Harvey and Lundblad, 2007). Any great illiquidity and its unpredictability is a source of market risk (Benić and Franić, 2008). Furthermore, illiquidity discourages investor interest in a market (Chuhan, 1994). Better liquidity of a stock market enables prompt transactions with a minimal impact on prices (Bernstein, 1987), and it is agreed among professionals that alongside transaction costs, liquidity represents an important factor in determining stock prices (Amihud and Mendelson, 1986; Datar, Naik and Radcliffe, 1998; Pástor and Stambaugh, 2003). Finally, Fernandez ( 1999) explains that liquidity is the “lifeblood” of financial markets, as it enables the smooth operation of economies, while erosion of liquidity can disrupt not only a single market, but also other connected markets worldwide.
Studies to date have been rather silent on this specific topic, so we utilize the recent tax reform in Croatia as a case study to contribute to the literature in this field. This is, to our knowledge, the first empirical study to analyse the impact of the newly introduced capital gains tax on the Croatian stock market, which makes it relevant to policy makers, investors, boards of listed companies and all other stakeholders in the country and abroad.
In Croatia, the capital gains tax, which includes security trading, came into force on 1 January 2016. Gains are taxed at the rate of 12% plus city surtax, which ranges between 0% and 18%. However, gains from the sales of shares (or other financial assets) acquired before 1 January 2016 and/or owned for more than two years are exempt. 2 This means that all gains from the shares acquired on 1 January 2016 or later will be taxed if they are sold within two years of their purchase. We hypothesize that such a policy created incentives for short-term investors to build up their portfolio with stocks bought prior to 1 January 2016 because they would not have been subject to taxation even if sold quickly, increasing trading volume near the end of 2015. Similarly, we hypothesize that the new tax created incentives not to trade (buy or sell) once the tax came into force because gains from such transactions became taxable, decreasing the volume of trade immediately after the introduction of the tax, but also in the longer term.
Our results are robust across various methodologies and model specifications. Results of the event study based on daily data confirmed our hypotheses. We find abnormally high trading volume patterns shortly before the tax came into force and abnormally low volume patterns after the fact. Our estimations based on monthly data point to the same conclusions. Regression discontinuity models confirmed a statistically significant break in the slope of the regression line precisely at the cut-off point when the tax was introduced, providing further evidence that the trading volume was increasing in the pre-tax period and then sizeably dropped when the tax entered into force. In addition, panel regression estimations suggested that the tax introduction resulted in a 45 percent below-average growth in trading volume the month the tax entered into force, and 16 percent above-average growth in trading volume in the last month before the tax was introduced. Finally, difference-in-differences estimations suggest that the average trading volume in the three post-tax years decreased by 23 percent from the pre-tax period, indicating that the consequences of introducing this tax are not only short-term, but also of a longer-term nature, creating important policy implications.
The paper is structured as follows. Section 2 presents a review of literature on the link between taxation and stock market trading volume. Section 3 describes the details of the methodology and data utilized in the analysis, while Section 4 reports the results. Section 5 deals with extensive robustness checks to test the validity of the results. The final section states the main conclusions of the analysis and offers policy recommendations.
2 Literature review
The literature usually observes reactions of volumes and return series with respect to tax introductions or changes. Thus, the first group of papers in this review section consists of research that focuses on such reactions. Changes in capital gains tax rates are found to affect the trading volume on the stock market. As shown by Slemrod (1982), tax cuts were connected to increases in trading volume and turnover rates on the New York Stock Exchange. However, no effect on the volume of trading was found after the capital gains tax increase in 1987 (Henderson, 1990). Japan was one of the advanced economies that introduced a capital gains tax fairly late (in 1989) and subsequently underwent a tax cut reform. Hayashida and Ono (2010) analysed the effects of these policy changes and found that the introduction of the capital gains tax negatively influenced individual trading, while the 2003 tax cut worked in the opposite direction. Gary et al. (2016) found similar results in a study based on US data, focusing on the effects of changes in various types of tax rates on the volume of intercorporate stock market investment.
Other authors found that stocks approaching the date of long-term tax qualification, i.e. the date after which their owner cannot be taxed on capital gains, have abnormal trading volumes around the date of qualification. For instance, Reese Jr. ( 1998) found that stocks that appreciated prior to long-term tax qualification exhibit increased trading volume just after their qualification date, while stocks that depreciated prior to long-term qualification exhibit these effects just prior to their qualification, because these strategies enable the sellers to decrease their tax burden and increase after-tax returns.
Some countries have implemented capital gains tax cut and tax exemption policies to increase participation, depth and liquidity in the domestic stock market. Agostini and Siravegna ( 2014) took Chile and its 2001 tax reform as a case study and found that the introduction of such policies led to a stock price decrease in the magnitude of 15%, due to the tax lock-in effect. Other types of taxation, such as transaction tax, have also been found to affect the stock market, but only with respect to the stock price, while no significant effect was found on market volatility and market turnover (Hu, 1998 ). There have also been studies suggesting that the impact of the tax rate changes may be overstated. Covering 50 years of investment data on US stock markets, Akindayomi ( 2013) found that it is not the changes in capital gains tax rates, but rather the possibility of realizing capital gains, or the lack thereof, that impacts stock market investments and investors’ behaviour.
In the literature on the methodology for testing abnormal trading volume, the common approach is to use the event study methodology (ESM). Seminal studies by Ajinkya and Jain ( 1989) and Cready and Ramanan ( 1991) extended the use of ESM to the analysis of stock returns and trading volume. Widely used test-statistics are those developed by Campbell and Wasley ( 1996) who imparted greater power to the tests. Yadav ( 1992) explains that trading volume is a useful variable to use in event study methodology. This is due to this volume reflecting the the different impacts new information arriving on the market makes. Individual investors are affected by new information differently due to different expectations on the market, clientele adjustments to taxes, information asymmetry, etc. Thus, the trading volume indicates the lack of a consensus when new information is interpreted.
Using the ESM approach, several studies found that the trading volume increases around the event day with respect to other announcements, such as changes of market index structure and dividend announcements. This group of papers is the second group within this literature overview, which utilizes the ESM approach, but does not focus on tax issues. For instance, Lakonishok and Vermaelen ( 1986) focused on the trading volume around ex-dividend days, by dividing the sample into subsamples for taxable distributions and non-taxable ones. Stocks of the CRISPR Therapeutics company were analysed in the period 1970-1981, with more than 2500 ex-dates for stock splits and stock dividends. Authors found significant increases of volume before and after the ex-dividend days. Bajaj and Vijh ( 1995) found not only the increase in volume around dividend announcement day (due to tax trading), but in volatility and returns as well. Other studies focus more on dividend announcements, mergers and acquisitions; stock market index composition changes, etc. (see Xu, Rui and Kim, 2002; Gregoriou, 2011; or Chaudary and Mirza, 2017). Some authors empirically evaluate the effects on stock returns and investor demand for stocks when capital gains taxes are put in place or are changed over time (Shackefold, 2000; Blouin, Raedy and Shackefold, 2000).
The existing literature allows several conclusions to be drawn. Firstly, the introduction of taxes hurts the trading volume and affects returns and volatilities on the majority of stock markets (see Akindayomi, 2013; Blouin, Raedy and Shackefold, 2003; Amoaku-Adu, Rashid and Stebbins, 1992; Dai, Shackelford and Zhang, 2013). Secondly, there is no clear consensus on how to solve the problem of taxation, in terms of completely abolishing taxes or finding some combination of tax brackets according to the type of investor and other classifications 3. This debate has been ongoing for a long time (see Fenberg and Summers, 1989).
Finally, we briefly mention the idea of speculative investing because one of the ideas of a capital gains tax could be to discourage such behaviour. The idea of speculative behaviour is not new (Miller, 1977; Harrison and Kreps, 1978), but the topic is still interesting (Janssen, Füllbrunn and Weitzel, 2019). Some of the main explanations include the heterogeneous beliefs of investors (Scheinkman and Xiong, 2003; Hong, Scheinkman and Xiong, 2006). In his long study on stabilizing the stock market, Repetti ( 1989) concludes that if the primary purpose for re-enactment of preferences for long-term capital gains is to curb speculation, it is not advisable to do so as it would decrease societal welfare.
3 Data and methodology
3.1 Data description
For the purpose of empirical analysis, daily trading volume data for 45 stocks have been collected from the ZSE (2019) website. The full list of stocks included is reported in the Appendix in Table A1. The most liquid stocks in terms of total turnover and number of transactions in 2018 have been selected for the analysis. The time span and data frequency used in this study differ depending upon the methodology used. Specifically, the first part of the analysis utilizes the daily data for the event study methodology. Here, we used the time span from 2 January 2015 until 1 February 2016.
We also employ two additional estimation methods – regression discontinuity design and panel regressions, which include the difference-in-differences estimations. These estimations are based on monthly data to further test whether the introduction of the tax had also longer-term consequences on trading volume than those implied by the ESM results. Thus, the estimation period covers a longer time period pre- and post-tax and runs from 2013:M01 to 2019:M01, making the preand post-event periods of similar size.
The pre-event window for the event study estimation of the market model of trading volumes is chosen to be from 2 January 2015 until 10 December 2015, with 236 daily observations for every volume series. MacKinlay ( 1997) recommends around 250 days for the pre-event window estimation, depending upon data availability and the topic of interest. The event-window length is usually short. Thus, we select the length of 21days, with 10 days prior and 10 days after the event day.
In later stages of our analysis, we focus on the regression discontinuity methodology and panel regressions. Here, we transformed the daily data to monthly frequencies, with the time span from 2013:M01 to 2019:M01. Detailed descriptive statistics both for monthly and daily frequencies are shown in the Appendix in Table A2.
Since the beginning of the Croatian stock market in 1997, several sub-periods can be distinguished. Firstly, the market was in a stagnant phase until 2003, which saw the start of the trend of an increasing growth of the official stock market index CROBEX, as well as of the number of transactions. That all ended with the crisis of 2008. The fast pre-crisis growth was due to the IPOs of several big companies such as HT, Ina, Atlantic Group, Ingra, Magma and Optima. The market recovery was very limited, and ended in 2010. Ever since, the whole market has been, broadly speaking, in a stagnant phase, with low trading volume and stagnating market index values (see Graphs 1 and 2).
Graph 1Market index value (right axis) and return series (left axis) on ZSE DISPLAY Graph
Legislative analysis regarding the trading on ZSE is detailed in Grubišić Šeba ( 2017), who argues that the legislation in Croatia did not enhance the development of ZSE, but instead resulted in the crowding out of small shareholders from the market. 4 Liquidity is one of the greatest problems on ZSE today (see Vidović, 2013; or Škrinjarić, 2018 for details), which is also evident from Graph 2.
Graph 2Total trading volume on ZSE, in mil HRK DISPLAY Graph
Graph 3 reports the yearly trading volume on ZSE, which shows a 15.1 percent decline in 2016 with respect to the previous year. Our hypothesis is that the introduction of the capital gains tax from 1 January 2016 played a role in this decline, which we test in the following sections. Graph 3 also indicates that the trading volume in 2017 bounced back strongly with a yearly growth rate of over 30 percent. However, this was primarily the result of a major fire sale of stocks of companies connected to the large food concern Agrokor, which had fallen into a major financial crisis that escalated in the first half of 2017.
Before formally testing our hypotheses, we compared average daily volumes in the 10 days prior to the event day with the average in the 10 days after. It turned out that 34 out of 45 stocks marked a decline in average trading volume. Moreover, the average monthly volumes in January 2016 were lower than in December 2015 for 36 stocks, while the cumulative monthly volume decreased for 37 stocks in the same period. Descriptive analysis suggests that the tax may have influenced the trading volumes on ZSE, which we test more formally in the following sections.
Graph 3Yearly total trading volume on ZSE (left axis, in billions), percentage change (right axis, in %) DISPLAY Graph
3.2 Event study methodology
Since the event study methodology is well established in literature, we give only a brief overview following MacKinlay (1997), Bartholdy, Olson and Peare (2007), and Campbell and Wasley (1996). ESM is usually used to show how stock return, volatility and trading volume reacted to different economic, political, social or other events. Moreover, ESM is usually applied over short-term horizons (several days prior to and after the event). The basic idea is to compare the actual returns, volatilities or volumes to those that would have occurred in the absence of the event.
The null hypothesis is that the event did not have a significant effect on the trading volume. Campbell and Wasley ( 1996) define the log-transformed relative volume for stock i at date t as: 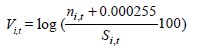 | (1) |
where ni,t denotes the number of shares traded at date t of stock i, Si,t the outstanding shares of the i-th stock at date t. Value of 0.000255 is added so that the value under the log is not zero if in some days there was no trading, as suggested by Campbell and Wasley (1996). The market model of abnormal trading volume (trading volume conditioned to the information set It) is estimated as follows: | E(Vi,t|It) = E(ai + biVM,t + εi,t) | (2) |
where VM,t is the market volume measure, ![]() ![]() ![]() ![]() ![]() ![]() ![]() ![]() ![]() ![]() ![]() ![]() ![]() ![]() ![]() ![]() 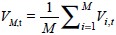 , calculated as the average trading ![]() volume of stocks contained in the market index. The estimation of (2) is done in the pre-event window ( t ε {1, 2, ..., τstart-1}) to avoid any effects of the event itself on the results. The usual assumption of εi ~ N (0, σi2) holds. It is assumed that the volume variable would behave as in (2) in the absence of the event. Next, it is assumed that parameters in (2) would define the expected volume in the event window as well, thus forecasts are made with model (2). These forecasts are used to calculate the abnormal volume, ῡτ, in the event window, defined as: where τ ε { τstart, … τevent, … , τend} is the index referring to the time span of the event window. The test statistic is the ratio of the average abnormal volume and the standard deviation, 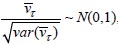 , under the null hypothesis. ![]()
Another approach to testing the null hypothesis is to use a nonparametric test, in which the ratio of the mean deviation of the stocks’ rank from the expected rank (regarding the size of the volume) is divided by the standard deviation of the portfolio mean abnormal rank: 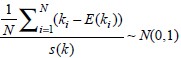 | (4) |
where ki is the rank of the i-th stock, and s(k) is the standard deviation of the portfolio mean abnormal rank. Corrado ( 1989), and Campbell and Wasley ( 1996) have shown that nonparametric tests are more powerful for detecting abnormal performance. Another advantage of these tests is that they do not depend upon the normality assumption. However, as the number of stocks in the test grows, the test statistic in (4) converges to a normal unit distribution. Other nonparametric tests include the binomial sign test, the Wilcoxon signed rank test, etc. (for more details see Sheskin, 1997).
3.3 Regression discontinuity design
We estimate the regression discontinuity (RD) model, designing the data in the potential outcomes framework (Rubin, 1974). The objective is to find the causal effect (Ci) of the treatment (the introduction of the capital gains tax), represented by the binary indicator Ti ϵ {0,1}, on unit i. We estimate the RD model with the sharp design, which means that the assignment of Ti is a deterministic function of the running time variable t, so that:  | (5) |
The causal effect is defined as: where Zi (1) denotes the potential outcome (trading volume) of unit i under treatment ( Ti = 1) and Zi (0) the potential outcome (trading volume) under control (Ti = 0). With the RD design, we estimate the average causal effect of treatment at the cut-off point, t = c:  | (7) |
We use monthly growth rates in average daily trading volume for each month (from 2013:M01 to 2019:M01) for the same 45 company stocks listed on the Zagreb Stock Exchange and denoted in Table A1 in the Appendix.
3.4 Panel regressions
Our third methodological approach utilizes panel regressions. We estimate a dynamic panel model with cross-section fixed effects: 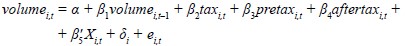 | (8) |
The vector of control variables, Xi,t, consists of the following variables: stdevi,t to control for the volatility of stock prices as an important determinant of trading volume on the stock market, measured as the monthly standard deviation of daily stock prices; returni,t to control for the monthly return of each stock; and the dummy variable januaryi,t (equals 1 for each January, 0 otherwise) to control for the possible existence of the so-called January effect on the Zagreb Stock Exchange (see, e.g. Stoica and Diaconasu, 2011 for the analysis of calendar anomalies on emerging Central and Eastern European stock markets).
As in RD design, we use monthly data for average daily trading volume for each month from 2013:M01 to 2019:M01, for the same 45 company stocks as before.
4 Results
4.1 Estimations with daily data
We first estimate the event study model with the pre-event window spanning the period from 2 January 2015 to 10 December 2015 to estimate equation (2). Next, we calculate the abnormal volumes, ῡτ, with the respective confidence intervals (CI) at the 95% confidence level. The results are shown in Graph 4, where day 0 on the x-axis corresponds to 31 December 2015 (the last trading day before the capital gains tax entered into force5).
It can be seen that the abnormal trading volume began before the event day, which indicates that investors increased their trading in the last few days of 2015. The abnormally high trading volume is statistically significant. We interpret this as evidence that the introduction of the tax had a significant effect on investors’ behaviour and trading on ZSE, because investors had incentives to accumulate as many tax-free securities in their portfolio as possible, with respect to their investing strategies.
Graph 4Abnormal volume (full line) with 95% CIs (dashed lines), classic inference DISPLAY Graph
In addition, we observe a strong negative response of the trading volume in the post-event period, with statistically negative responses on days two 6 and five. This suggests that the introduction of the tax created disincentives to trading because all capital gains from securities acquired after 1 January 2016 were subject to taxation, hurting the liquidity of the market.
In addition to the results reported on Graph 4, which were estimated with the classic T-inference for the event study estimator, we re-estimated equation (2) with the bootstrap approach for the same estimator. Graph 5 shows the result of the bootstrap approach, with 1000 replications and sampling with replacement done within the units of observation. This approach is chosen because it corrects for possible biases in the results due to the possible non-normal distribution of the data and serial correlation (see Hein and Westfall, 2014 for details). The results indicate the same conclusions with respect to the trading volume in the pre- and post-event period.
Graph 5Abnormal volume (full line) with 95% CIs (dashed lines), bootstrap inference DISPLAY Graph
Finally, equation (2) was estimated using the nonparametric Wilcoxon sign test (Graph 6). Although the CIs in this case are wide when compared to the previous ones, the conclusions regarding several days before the event day and the fifth day post-event are the same: we detect statistically significant abnormal trading volume on ZSE. The greatest effects were found on the day before the event and on day 0 (Graphs 4, 5 and 6).
Graph 6Abnormal volume (full line) with 95% CIs (dashed lines), Wilcoxon inference DISPLAY Graph
Two additional nonparametric tests were performed, the results of which are reported in Table 1. The sign tests with the respective assumptions of the normal and exact binomial distribution were performed for every day in the event period. Since these tests are useful for detecting changes in the value of a variable before and after the treatment, we additionally conduct this test by comparing the abnormal volume stocks’ rank with the median rank. Results indicate significant effects of the tax introduction both before and after day 0, which is also evidence in favour of our research hypothesis. It is important to note that these particular tests do not answer the question whether the impact on the trading volume is positive or negative. The test values are all positive because their construction is based upon sample proportions.
Table 1Nonparametric tests results DISPLAY Table
The results indicating the increase of the trading volume on ZSE shortly before the introduction of the capital gains tax, and the decrease right after its coming into force, are in line with the findings in Lakonishok and Vermaelen ( 1986), Bajaj and Vijh ( 1995), and Xu, Rui and Kim ( 2002). They are also in line with the theory in Karpoff ( 1986), Varian ( 1989), and He and Wang ( 1995), i.e. the pre-announcement disagreement hypothesis, because the abnormal trading volume patterns were found prior to the event day. This hypothesis says that, although investors can agree upon the implications of an announcement (in this case the introduction of a tax), the pre-event uncertainty is sometimes too high, so that the disagreement causes the increase in the trading volume. However, nonparametric tests provide evidence in favour of a differential interpretation hypothesis (significant results after the event day) as well, but, as Kim and Verrecchia ( 1991a; 1991b) state, the two hypotheses are not mutually exclusive, due to the information asymmetry before the event day.
4.2 Estimations with monthly data
4.2.1 Regression discontinuity design
Graph 7 plots the regression function fits of polynomials of various orders, with the cut-off date set at January 2016, when the tax was first introduced. The default type of estimation in Stata 15 software is the polynomial fit of order 4 (panel a of Graph 7), which shows a significant break in the slope of the regression line precisely at the cut-off point. It confirms that the trading volume increased in the pre-tax period and then sizably dropped when the tax entered into force. This probably reflects the increased incentives for the accumulation of non-taxable securities in the pre-tax period, and then the lack of incentives to trade once the tax was introduced. Other panels of Graph 7, showing various polynomial orders, confirm the same narrative.
Graph 7Regression function fits of polynomials of various orders from the regression discontinuity model (2013:M01 – 2019:M01) DISPLAY Graph
Table 2 reports the tests for the statistical significance of these estimations. The discontinuity in the trading volume is confirmed across all polynomial orders using the bias-corrected local polynomial estimator, and for all polynomial orders other than order 1 using the robust standard-error estimator. Right after the cut-off point (the introduction of the tax), there was a reduction in the trading volume growth rate of between 41% and 72%, depending on the polynomial order. This is measured by taking a difference in the mean values to the left of the cut-off point (before January 2016) and the mean values to the right of the cut-off point (after January 2016). This neighbourhood, called the bandwidth, includes approximately 750 observations on each side of the cut-off point.
Table 2Sharp regression discontinuity estimated coefficients using local polynomial regression DISPLAY Table
4.2.2 Panel regressions
We estimated the models using panel EGLS estimator with cross-section weights (models 1-3 in Table 3), but also the models without the weights (models 4-6 in Table 3). We estimated various iterations of models where volumei,t represents monthly growth rates of the average trading volume, as well as the logarithm of the trading volume, and non-transformed trading volume in Croatian kunas (HRK), respectively.
Table 3Results of panel regression estimations (2013:M01-2019:M01) DISPLAY Table
The results reported in Table 3 suggest a statistically significant negative effect of the introduction of the tax on trading volume in January 2016 (variable tax) and a significant positive effect in December 2015, the last month before the tax entered into force (variable pretax). Results hold across almost all specifications.
After controlling for all other variables, the benchmark model (1) suggests that the tax introduction resulted in a 45 percent average decrease in the trading volume growth rate per stock per trading day that month. Results also suggest a 16 percent increase in the trading volume growth rate in December 2015, likely reflecting the incentives for investors to accumulate tax-free securities in their portfolios. These findings confirm the results of the event study methodology and the regression discontinuity model presented earlier.
The monetary effect of the tax on the trading volume is not negligible. According to model (3), the trading volume decreased on average by HRK 27,961 per stock per trading day in January 2016. There were 19 trading days in January 2016, which, multiplied by 45 stocks, suggests an average negative effect of the tax in the amount of HRK 24 million in trading volume that month alone.
We also estimate panel regressions in a difference-in-differences framework using country-level instead of stock-level data to find causal effects of the tax on the trading volume with a longer-term perspective. We first estimate a naïve difference- in-differences parameter using data on the overall trading volume on the Croatian stock market as the treated group, and the period from 2016:M01 onwards as the post-treatment period. Our control group consists of other noneurozone EU members from Central and Eastern Europe – Bulgaria, Czech Republic, Hungary, Poland, and Romania. The results are reported in Table 4, model (1). As can be seen, the naïve difference-in-differences parameter is negative and statistically significant for the Croatian trading volume in the three years following December 2015, confirming the negative effect of the tax.
To get a better sense of the size of the negative causal effects, we also estimated a conditional difference-in-differences model including cross-country control variables such as the stock market returns and volatility, interest rates, growth in money supply, and exchange rate volatility (model 2 in Table 4). The differencein-differences parameter is that on the interaction between an indicator for Croatia and an indicator for the period post-December 2015. Model (3) is the same as (2), but excludes the period after 2016:M12 to exclude the possibility of the Agrokor crisis affecting the results.
Table 4Difference-in-Differences estimation results DISPLAY Table
Both model (2) and model (3) indicate a statistically significant negative long-term effect of the tax on the trading volume. Results suggest that the average trading volume in the three post-tax years decreased by 23 percent (model 2) when compared to the pre-tax period, and decreased 27 percent in the first year following the tax (model 3), respectively. This indicates that the consequences of introducing this tax on the trading volume on ZSE are not only short-term (captured in days before and after the tax coming into force), but also of a longer-term nature, which carries important policy implications.
5 Robustness checks
Our robustness check focuses mainly on the possibility that the Agrokor crisis, which started in the first half of 2017, could have affected the results. Thus, we estimated the same RD model but with the data ending in 2016:M12. Graph 8 confirms that the main conclusions remain robust even when we change the period of analysis, with statistically significant breaks in the slope of the regression line right at the cut-off point.
Graph 8Regression function fits of polynomials of various orders from the regression discontinuity model (2013:M01 – 2016:M12) DISPLAY Graph
We also estimated panel regression models with the sample period ending in 2016:M12 (models 7-12) to test for the possibility that the Agrokor crisis affected the results. Table 5 confirms the negative tax effect in January 2016 and a positive one in December 2015 across various specifications.
Table 5Results of panel regression estimations (2013:M01-2016:M12) DISPLAY Table
The benchmark model (7) suggests a 49 percent average decrease in the trading volume growth rate in January 2016, with the negative monetary effect of HRK 27 million on the trading volume in that month alone.
Positive values of the january dummy variable are in line with Lakonishok and Smidt ( 1984), Ajinkya, Atiase and Gift ( 1991), Atiase and Bamber ( 1994) and Bamber, Barron and Stober ( 1997; 1999) who find greater trading volume in January, which affects stock prices as well.
The Agrokor crisis not affecting the results was also confirmed in our difference-in-differences estimations also confirmed that the Agrokor crisis did not affect the results, as already shown in Table 4.
6 Conclusion and policy implications
Building on the literature on the effects of taxation on stock market dynamics, this paper analysed the effects of the recently introduced capital gains tax on the trading volume on the Zagreb Stock Exchange before and after its coming into force in January 2016. We analysed the effects using three different methodological approaches – event study methodology, regression discontinuity design and panel regressions.
Results of the event study based on daily data confirmed the hypothesis that the introduction of the capital gains tax created abnormally high trading volume patterns shortly before the tax came into force and abnormally low volume patterns after the fact. Our estimations based on monthly data confirmed these findings. Regression discontinuity models indicated a statistically significant break in the slope of the regression line precisely at the cut-off point when the tax was introduced, providing further evidence that the trading volume increased in the pre-tax period and then substantially dropped when the tax entered into force. In addition, panel regression estimations suggested that the tax introduction resulted in a 45 percent decrease in the trading volume growth rate the month tax entered into force, and a 16 percent increase in the growth in trading volume in the last month before the tax was introduced. Finally, difference-in-differences estimations suggest that the average trading volume in the three post-tax years was 23 percent lower than in the pre-tax period, indicating that the consequences of introducing this tax are not only short-term, but also of a longer-term nature.
Overall, our main conclusions remain unchanged after thorough and extensive robustness checks and provide strong evidence that the announcement of the new tax created incentives for investors to build up a portfolio of tax-free securities before it came into force, as well as created disincentives to buying and selling stocks after 1 January 2016 because of the new tax burden on newly acquired securities, hurting the liquidity of an already weakly liquid market.
To our knowledge, this is the first empirical study to have analysed the impact of a newly introduced capital gains tax on the Croatian stock market. The results of this paper should thus be of interest and relevance to policy makers, investors, boards of listed companies and all other stakeholders in the country. It can also serve as a useful policy input not only to Croatian policy makers, but also to those in other countries with small, poorly developed and shallow stock markets, characterized by low levels of liquidity, which have not yet introduced this type of taxation.
Given that the taxation of capital gains in Croatia is not a separate tax form, but rather a part of a much wider income tax, the detailed statistics on how big the revenues from this type of taxation actually are, are not publicly available. However, we can approximate this amount by looking at the revenues from taxes on income from capital, which comprises not only the taxation of capital gains, but also income from dividends and interest. These revenues were HRK 146 million higher in 2016 than in 2015 (Ministry of Finance, 2019), which can be interpreted as a rough estimate of revenue from the capital gains tax, given that the taxation of income from dividends and interest had been introduced earlier. This would imply that the revenue from the capital gains tax constitutes only 0.36% of revenues of local government7, suggesting that its fiscal effects are almost negligible. On the other hand, however, the effects of introducing such a tax, as our study has shown, have had serious adverse consequences on market liquidity and the participation of small investors in the stock market. In these circumstances, one can conclude that the introduction of such a tax created a large problem for only a small gain – explaining the idiom from the title of this paper.
One of the main policy recommendations of this study is that countries with underdeveloped and poorly liquid stock markets should avoid introducing taxes that can further discourage the interest of the public in participating in the market. This can incentivize individuals and companies to invest their money into other types of assets with a more preferential tax treatment (e.g. the real estate market), increasing the possibilities for dangerous asset price bubbles. Our study suggests that fiscal (tax) policy in these countries should be used in the opposite direction – to encourage investment and attract as many new investors as possible, resulting in higher liquidity and facilitating faster development of the stock market.
Future empirical work should explore which hypothesis, the pre-announcement disagreement or the differential interpretation hypothesis, is stronger on ZSE, because each hypothesis assumes different effects of trading volume on the volatility of stock returns. Another avenue for future research is examining the effects of abnormal trading volume on stock returns, volatilities and other hypotheses (such as the clientele hypothesis, see Kross, Ha and Heflin, 1994) to make clear distinctions on the (dis)agreement about the distribution of the uncertainty regarding the event of interest.
Appendix
Funding
* This paper was supported by the Croatian Science Foundation under project no. 6785.
Notes
** The authors want to thank the anonymous reviewers for insightful comments and suggestions.
1 The taxation of income from capital gains in Croatia was introduced not as a new tax form, but rather as part of the income tax reform contained in the changes in the Law on income tax (NN 115/16). However, for the sake of clarity, convenience, and compatibility with the existing literature, we will refer to the taxation of income from capital gains in Croatia as the “capital gains tax” throughout this paper.
2 Initially, the exemption was granted only to gains from the sales of shares owned for more than three years, but that period was subsequently cut to two years.
3 See, for example Jin (2006) – it cannot be argued that increasing capital gains tax rates will slow down trad¬ing on a stock market; whereas Auten (1999) states that lower and middle income taxpayers are losers in the long run. Other literature on pros and cons with respect to the amount of tax rates, their introduction or sus¬pension can be found in Akindayomi (2013).
4 For a more detailed discussion on the link between legislation and the composition of investors on ZSE see Grubišić Seba (2017).
5 The “0” day remains 31 Dec 2015, as stocks bought from 1 Jan 2016 were subjected to taxation (if they were sold within 3 years after purchase). Thus, the zero day is the last “neutral” day when compared to +1 day which is now in Jan 2016.
6 Although it seems that on day two the zero value is included in the confidence intervals, the upper interval value is -0.004, which excludes the zero value.
7 Revenues from the income taxes are revenues of the local government.
** The authors want to thank the anonymous reviewers for insightful comments and suggestions.
1 The taxation of income from capital gains in Croatia was introduced not as a new tax form, but rather as part of the income tax reform contained in the changes in the Law on income tax (NN 115/16). However, for the sake of clarity, convenience, and compatibility with the existing literature, we will refer to the taxation of income from capital gains in Croatia as the “capital gains tax” throughout this paper.
2 Initially, the exemption was granted only to gains from the sales of shares owned for more than three years, but that period was subsequently cut to two years.
3 See, for example Jin ( 2006) – it cannot be argued that increasing capital gains tax rates will slow down trad¬ing on a stock market; whereas Auten ( 1999) states that lower and middle income taxpayers are losers in the long run. Other literature on pros and cons with respect to the amount of tax rates, their introduction or sus¬pension can be found in Akindayomi ( 2013).
4 For a more detailed discussion on the link between legislation and the composition of investors on ZSE see Grubišić Seba ( 2017).
5 The “0” day remains 31 Dec 2015, as stocks bought from 1 Jan 2016 were subjected to taxation (if they were sold within 3 years after purchase). Thus, the zero day is the last “neutral” day when compared to +1 day which is now in Jan 2016.
6 Although it seems that on day two the zero value is included in the confidence intervals, the upper interval value is -0.004, which excludes the zero value.
7 Revenues from the income taxes are revenues of the local government.
Disclosure statement
No potential conflict of interest was reported by the authors.
References
Agostini, C. and Siravegna, M. C., 2014. The Effect of the Capital Gains Tax Exemption on Stock Market Prices in Chile. Revista de Analisis Economico - Economic Analysis Review, 29(2), pp. 25-46.
Ajinkya, B. B., Atiase, R. K. and Gift, M. J., 1991. Volume of trading and the dispersion of analysts' earnings forecasts. The Accounting Review, 66(2), pp. 389-401.
Ajinkya, B. P. and Jain, P. C., 1989. The Behaviour of Daily Stock Market Trading Volume. Journal of Accounting and Economics, 11(4), pp. 331-360 [ CrossRef]
Akindayomi, A., 2013. Capital gains taxation and stock market investments: empirical evidence. Accounting and Taxation, 5(2), pp. 1-12.
Amihud, Y. and Mendelson, H., 1986. Liquidity and stock returns. Financial Analysts Journal, 42(3), pp. 43-48 [ CrossRef]
Amoako-Adu, B., Rashid, M. and Stebbins, M., 1992. Capital gains tax and equity values: Empirical test of stock price reaction to the introduction and reduction of capital gains tax exemption. Journal of Banking and Finance, 16(2), pp. 275-287 [ CrossRef]
Atiase, R. K. and Bamber, L. S., 1994. Trading volume reactions to annual accounting earnings announcements. Journal of Accounting and Economics, 17(3), pp. 309-329.
Auten, G., 1999. Capital Gains Taxation. In: J. Cordes, R. D. Ebel and J. G. Gravelle, eds. The Encyclopedia of Taxation and Tax Policy. Urban Institute Press. [ CrossRef]
Bajaj, M. and Vijh, A. M., 1995. Trading Behavior and the Unbiasedness of the Market Reaction to Dividend Announcement. The Journal of Finance, 50, pp. 255-279 [ CrossRef]
Bamber, L. S., Barron, O. E. and Stober, T. L., 1997. Trading volume and different aspects of disagreement coincident with earnings announcements. The Accounting Review, 72(4), pp. 575-597.
Bamber, L. S., Barron, O. E. and Stober, T. L., 1999. Differential interpretations and trading volume. Journal of Financial and Quantitative Analysis, 34(3), pp. 369-386 [ CrossRef]
Bartholdy, J., Olson, D. and Peare, P., 2007. Conducting event studies on small stock exchange. The European Journal of Finance, 13, pp. 227-252 [ CrossRef]
Bekaert, G., Harvey, C. R. and Lundblad, C., 2007. Liquidity and Expected Returns: Lessons from Emerging Markets. Review of Financial Studies, 20(6), pp. 1783-1831 [ CrossRef]
Bernstein, P. L., 1987. Liquidity, Stock Markets, and Market Makers. Financial Management, 16(2), pp. 54-62 [ CrossRef]
Blouin, J. L., Raedy, J. S. and Shackefold, D. A., 2000. Capital Gains Taxes and Stock Reactions to Quarterly Earnings Announcements. NBER Working Paper, No. 7644. [ CrossRef]
Blouin, J. L., Raedy, J. S. and Shackerfold, D. A., 2003. Capital Gains Taxes and Equity Trading: Empirical Evidence. Journal of Accounting Research, 41(4), pp. 611-651 [ CrossRef]
Campbell, C. J. and Wasley, C. E., 1996. Measuring Abnormal Trading Volume for Samples of NYSE/ASE and NASDAQ Securities Using Parametric and Nonparametric Test Statistics. Review of Quantitative Finance and Accounting, 6, pp. 309-326 [ CrossRef]
Chaudary, S. and Mirza, N., 2017. Domestic and cross-border returns to bidders in acquisitions into the EU. Economic research-Ekonomska istraživanja, 30(1), pp. 1021-1032 [ CrossRef]
Chuhan, P., 1994. Are Institutional Investors an Important Source of Portfolio Investment in Emerging Markets?. Washington, DC: The World Bank Press.
Corrado, C. J., 1989. A nonparametric test for abnormal security-price performance in event studies. Journal of Financial Economics, 23(2), pp. 385-395 [ CrossRef]
Cready, W. M. and Ramanan, R., 1991. The Power of Tests Employing Log-Transformed Volume in Detecting Abnormal Trading. Journal of Accounting and Finance, 14, pp. 203-215 [ CrossRef]
Dai, Z., Shackelford, D. A. and Zhang, H. H., 2013. Capital Gains Taxes and Stock Return Volatility. The Journal of the American Taxation Association, 35(2), pp. 1-31 [ CrossRef]
Datar, V. T., Naik, N. Y. and Radcliffe, R., 1998. Liquidity and stock returns: An alternative test. Journal of Financial Markets, 1(2), pp. 203-219 [ CrossRef]
Dyl, E. A., 1977. Capital gains taxation and year‐end stock market behavior. The Journal of Finance, 32(1), pp. 165-175 [ CrossRef]
Fenberg, L. and Summers, L. H., 1989. Who Benefits from Capital Gains Tax Reductions?. In: L. H. Summers, ed. T ax Policy and the Economy: Volume 4 [ CrossRef]
Fernandez, F. A., 1999. Liquidity risk. SIA Working Paper.
Frazzini, A., 2006. The disposition effect and underreaction to news. The Journal of Finance, 61(4), pp. 2017-2046.
Gary, R. F. [et al.], 2016. The impact of tax rate changes on intercorporate investment. Advances in accounting, 34, pp. 55-63 [ CrossRef]
Gregoriou, A., 2011. The Liquidity Effects of Revisions to the CAC40 Stock Index. Applied Financial Economics, 21(5), pp. 333-341 [ CrossRef]
Grubišić Šeba, M., 2017. 20 Years of the Croatian Capital Market. Zagreb International Review of Economics and Business, 20(1), pp. 41-58 [ CrossRef]
Harrison, M. and Kreps, D., 1978. Speculative Investor Behavior in a Stock Market with Heterogeneous Expectations. Quarterly Journal of Economics, 92(2), pp. 323-336 [ CrossRef]
Hayashida, M. and Ono, H., 2010. Capital gains tax and individual trading: The case of Japan. Japan and the World Economy, 22(4), pp. 243-253 [ CrossRef]
He, H. and Wang, J., 1995. Differential Information and Dynamic Behavior of Stock Trading Volume. The Review of Financial Studies, 8(4), pp. 919-972 [ CrossRef]
Hein, S. E. and Westfall, P., 2004. Improving tests of abnormal returns by bootstrapping the multivariate regression model with event parameters. Journal of Financial Econometrics, 2, pp. 451-471 [ CrossRef]
Henderson, Y. K., 1990. Capital gains tax rates and stock market volume. National Tax Journal, 43(4), pp. 411-425.
Hong, H., Scheinkman, J. and Xiong, W., 2006. Asset float and speculative bubbles. The Journal of Finance, 61(3), pp. 1073-1117 [ CrossRef]
Hu, S. Y., 1998. The effects of the stock transaction tax on the stock market–experiences from Asian markets. Pacific-Basin Finance Journal, 6(3-4), pp. 347-364 [ CrossRef]
Janssen, D-J., Füllbrunn, S. and Weitzel, U., 2019. Individual speculative behavior and overpricing in experimental asset markets. Experimental Economics, 22(3), pp. 653-675 [ CrossRef]
Jin, L., 2006. Capital gains tax overhang and price pressure. Journal of Finance, 61(3), pp. 1399-1431 [ CrossRef]
Karpoff, J., 1986. A Theory of Trading Volume. The Journal of Finance, 41(5), pp. 1069-1087.
Kim, O. and Verrecchia, R. E., 1991a. Market Reaction to Anticipated Announcements. Journal of Financial Economics, 30(2), pp. 273-309.
Kim, O. and Verrecchia, R. E., 1991b. Trading Volume and Price Reactions to Public Announcement. Journal of Accounting Research, 29(2), pp. 109-126.
Kross, W., Ha, G. L. and Heflin, R., 1994. A Test of Risk Clientele Effects via an Examination of Trading Volume Response to Earnings Announcements. Journal of Accounting and Economics, 18(1), pp. 67-87 [ CrossRef]
Lakonishok, J. and Smidt, S., 1984. Volume and turn-of-the-year behavior. Journal of Financial Economics, 13(3), pp. 435-455 [ CrossRef]
Lakonishok, J. and Vermaelen, T., 1986. Tax-Induced Trading around Ex-Dividend Days. Journal of Financial Economics, 16, pp. 287-319 [ CrossRef]
Lei, X., Zhou, Y. and Zhu, X., 2013. Capital gains, illiquidity, and stock returns. Pacific-Basin Finance Journal, 25, pp. 273-293 [ CrossRef]
MacKinlay, A. C. 1997. Event Studies in Economics and Finance. Journal of Economic Literature, 35, pp. 13-39.
Miller, M. H., 1977. Debt and Taxes. The Journal of Finance, 32(2), pp. 261-275.
Minović, J., 2012. Liquidity of the Croatian Stock Market: An Empirical Analysis. Economic research-Ekonomska istraživanja, 25(3), pp. 776-802 [ CrossRef]
Pástor, L. and Stambaugh, R. F., 2003. Liquidity risk and expected stock returns. Journal of Political economy, 111(3), pp. 642-685 [ CrossRef]
Reese Jr., W. A., 1998. Capital gains taxation and stock market activity: Evidence from IPOs. The Journal of Finance, 53(5), pp. 1799-1819 [ CrossRef]
Repetti, J. R., 1989. The Use of Tax Law to Stabilize the Stock Market: The Efficacy of Holding Period Requirements. Virginia Tax Review, 8, pp. 591-637.
Rubin, D. B., 1974. Estimating causal effects of treatments in randomized and nonrandomized studies. Journal of Educational Psychology, 66(5), pp. 688-701 [ CrossRef]
Shackefold, D. A., 2000. Stock Market Reaction to Capital Gains Tax Changes: Empirical Evidence from the 1997 and 1998 Tax Acts. Tax Policy and the Economy, 14, pp. 67-92 [ CrossRef]
Sheskin, D. J., 1997. Parametric and Nonparametric Statistical Procedures. Boca Raton: CRC Press.
Škrinjarić, T., 2018. Revisiting herding investment behaviour on Zagreb Stock Exchange: a quantile regression approach. Econometric Research in Finance, 3(1), pp. 119-162 [ CrossRef]
Slemrod, J., 1982. Stock transactions volume and the 1978 capital gains tax reduction. Public Finance Quarterly, 10(1), pp. 3-16 [ CrossRef]
Stoica, O. and Diaconasu, D., 2011. An Examination of the Calendar Anomalies on Emerging Central and Eastern European Stock Markets. Recent Researches in Applied Economics, 11, pp. 116-121.
Varian, H. R., 1989. Differences of Opinion in Financial Markets, Financial Risk Theory, Evidence and I Implications. Proceedings of the 11th Annual Economic Policy Conference of the Federal Reserve Bank of St. Louis. Boston: Kluwer [ CrossRef]
Vidović, J., 2013. Investigation of stock illiquidity on Central and South East European markets in naïve portfolio framework. Economic thought and practice-Ekonomska misao i praksa, 2, pp. 537-550.
Vidović, J., Poklepović, T. and Aljinović, Z., 2014. How to Measure Illiquidity on European Emerging Stock Markets?. Business Systems Research: International journal of the Society for Advancing Innovation and Research in Economy, 5(3), pp. 67-81 [ CrossRef]
Xu, P., Rui, O. M. and Kim, S., 2002. Risk Shift Following Dividend Change Announcement: The Role of Trading. Review of Quantitative Finance and Accounting, 19, pp. 45-63.
Yadav, P. K. 1992. Event studies based on volatility of returns and trading volume: A review. The British Accounting Review, 24(2), pp. 157-184 [ CrossRef]
Agostini, C. and Siravegna, M. C., 2014. The Effect of the Capital Gains Tax Exemption on Stock Market Prices in Chile. Revista de Analisis Economico - Economic Analysis Review, 29(2), pp. 25-46.
Ajinkya, B. B., Atiase, R. K. and Gift, M. J., 1991. Volume of trading and the dispersion of analysts' earnings forecasts. The Accounting Review, 66(2), pp. 389-401.
Ajinkya, B. P. and Jain, P. C., 1989. The Behaviour of Daily Stock Market Trading Volume. Journal of Accounting and Economics, 11(4), pp. 331-360 [ CrossRef]
Akindayomi, A., 2013. Capital gains taxation and stock market investments: empirical evidence. Accounting and Taxation, 5(2), pp. 1-12.
Amihud, Y. and Mendelson, H., 1986. Liquidity and stock returns. Financial Analysts Journal, 42(3), pp. 43-48 [ CrossRef]
Amoako-Adu, B., Rashid, M. and Stebbins, M., 1992. Capital gains tax and equity values: Empirical test of stock price reaction to the introduction and reduction of capital gains tax exemption. Journal of Banking and Finance, 16(2), pp. 275-287 [ CrossRef]
Atiase, R. K. and Bamber, L. S., 1994. Trading volume reactions to annual accounting earnings announcements. Journal of Accounting and Economics, 17(3), pp. 309-329.
Auten, G., 1999. Capital Gains Taxation. In: J. Cordes, R. D. Ebel and J. G. Gravelle, eds. The Encyclopedia of Taxation and Tax Policy. Urban Institute Press. [ CrossRef]
Bajaj, M. and Vijh, A. M., 1995. Trading Behavior and the Unbiasedness of the Market Reaction to Dividend Announcement. The Journal of Finance, 50, pp. 255-279 [ CrossRef]
Bamber, L. S., Barron, O. E. and Stober, T. L., 1997. Trading volume and different aspects of disagreement coincident with earnings announcements. T he Accounting Review, 72(4), pp. 575-597.
Bamber, L. S., Barron, O. E. and Stober, T. L., 1999. Differential interpretations and trading volume. Journal of Financial and Quantitative Analysis, 34(3), pp. 369-386 [ CrossRef]
Bartholdy, J., Olson, D. and Peare, P., 2007. Conducting event studies on small stock exchange. The European Journal of Finance, 13, pp. 227-252 [ CrossRef]
Bekaert, G., Harvey, C. R. and Lundblad, C., 2007. Liquidity and Expected Returns: Lessons from Emerging Markets. Review of Financial Studies, 20(6), pp. 1783-1831 [ CrossRef]
Bernstein, P. L., 1987. Liquidity, Stock Markets, and Market Makers. Financial Management, 16(2), pp. 54-62 [ CrossRef]
Blouin, J. L., Raedy, J. S. and Shackefold, D. A., 2000. Capital Gains Taxes and Stock Reactions to Quarterly Earnings Announcements. NBER Working Paper, No. 7644. [ CrossRef]
Blouin, J. L., Raedy, J. S. and Shackerfold, D. A., 2003. Capital Gains Taxes and Equity Trading: Empirical Evidence. Journal of Accounting Research, 41(4), pp. 611-651 [ CrossRef]
Campbell, C. J. and Wasley, C. E., 1996. Measuring Abnormal Trading Volume for Samples of NYSE/ASE and NASDAQ Securities Using Parametric and Nonparametric Test Statistics. Review of Quantitative Finance and Accounting, 6, pp. 309-326 [ CrossRef]
Chaudary, S. and Mirza, N., 2017. Domestic and cross-border returns to bidders in acquisitions into the EU. Economic research-Ekonomska istraživanja, 30(1), pp. 1021-1032 [ CrossRef]
Chuhan, P., 1994. Are Institutional Investors an Important Source of Portfolio Investment in Emerging Markets?. Washington, DC: The World Bank Press.
Corrado, C. J., 1989. A nonparametric test for abnormal security-price performance in event studies. Journal of Financial Economics, 23(2), pp. 385-395 [ CrossRef]
Cready, W. M. and Ramanan, R., 1991. The Power of Tests Employing Log-Transformed Volume in Detecting Abnormal Trading. Journal of Accounting and Finance, 14, pp. 203-215 [ CrossRef]
Dai, Z., Shackelford, D. A. and Zhang, H. H., 2013. Capital Gains Taxes and Stock Return Volatility. The Journal of the American Taxation Association, 35(2), pp. 1-31 [ CrossRef]
Datar, V. T., Naik, N. Y. and Radcliffe, R., 1998. Liquidity and stock returns: An alternative test. Journal of Financial Markets, 1(2), pp. 203-219 [ CrossRef]
Dyl, E. A., 1977. Capital gains taxation and year‐end stock market behavior. The Journal of Finance, 32(1), pp. 165-175 [ CrossRef]
Fenberg, L. and Summers, L. H., 1989. Who Benefits from Capital Gains Tax Reductions?. In: L. H. Summers, ed. T ax Policy and the Economy: Volume 4 [ CrossRef]
Fernandez, F. A., 1999. Liquidity risk. SIA Working Paper.
Frazzini, A., 2006. The disposition effect and underreaction to news. The Journal of Finance, 61(4), pp. 2017-2046.
Gary, R. F. [et al.], 2016. The impact of tax rate changes on intercorporate investment. Advances in accounting, 34, pp. 55-63 [ CrossRef]
Gregoriou, A., 2011. The Liquidity Effects of Revisions to the CAC40 Stock Index. Applied Financial Economics, 21(5), pp. 333-341 [ CrossRef]
Grubišić Šeba, M., 2017. 20 Years of the Croatian Capital Market. Zagreb International Review of Economics and Business, 20(1), pp. 41-58 [ CrossRef]
Harrison, M. and Kreps, D., 1978. Speculative Investor Behavior in a Stock Market with Heterogeneous Expectations. Quarterly Journal of Economics, 92(2), pp. 323-336 [ CrossRef]
Hayashida, M. and Ono, H., 2010. Capital gains tax and individual trading: The case of Japan. Japan and the World Economy, 22(4), pp. 243-253 [ CrossRef]
He, H. and Wang, J., 1995. Differential Information and Dynamic Behavior of Stock Trading Volume. The Review of Financial Studies, 8(4), pp. 919-972 [ CrossRef]
Hein, S. E. and Westfall, P., 2004. Improving tests of abnormal returns by bootstrapping the multivariate regression model with event parameters. Journal of Financial Econometrics, 2, pp. 451-471 [ CrossRef]
Henderson, Y. K., 1990. Capital gains tax rates and stock market volume. National Tax Journal, 43(4), pp. 411-425.
Hong, H., Scheinkman, J. and Xiong, W., 2006. Asset float and speculative bubbles. The Journal of Finance, 61(3), pp. 1073-1117 [ CrossRef]
Hu, S. Y., 1998. The effects of the stock transaction tax on the stock market–experiences from Asian markets. Pacific-Basin Finance Journal, 6(3-4), pp. 347-364 [ CrossRef]
Janssen, D-J., Füllbrunn, S. and Weitzel, U., 2019. Individual speculative behavior and overpricing in experimental asset markets. Experimental Economics, 22(3), pp. 653-675 [ CrossRef]
Jin, L., 2006. Capital gains tax overhang and price pressure. Journal of Finance, 61(3), pp. 1399-1431 [ CrossRef]
Karpoff, J., 1986. A Theory of Trading Volume. The Journal of Finance, 41(5), pp. 1069-1087.
Kim, O. and Verrecchia, R. E., 1991a. Market Reaction to Anticipated Announcements. Journal of Financial Economics, 30(2), pp. 273-309.
Kim, O. and Verrecchia, R. E., 1991b. Trading Volume and Price Reactions to Public Announcement. Journal of Accounting Research, 29(2), pp. 109-126.
Kross, W., Ha, G. L. and Heflin, R., 1994. A Test of Risk Clientele Effects via an Examination of Trading Volume Response to Earnings Announcements. Journal of Accounting and Economics, 18(1), pp. 67-87 [ CrossRef]
Lakonishok, J. and Smidt, S., 1984. Volume and turn-of-the-year behavior. Journal of Financial Economics, 13(3), pp. 435-455 [ CrossRef]
Lakonishok, J. and Vermaelen, T., 1986. Tax-Induced Trading around Ex-Dividend Days. Journal of Financial Economics, 16, pp. 287-319 [ CrossRef]
Lei, X., Zhou, Y. and Zhu, X., 2013. Capital gains, illiquidity, and stock returns. Pacific-Basin Finance Journal, 25, pp. 273-293 [ CrossRef]
MacKinlay, A. C. 1997. Event Studies in Economics and Finance. Journal of Economic Literature, 35, pp. 13-39.
Miller, M. H., 1977. Debt and Taxes. The Journal of Finance, 32(2), pp. 261-275.
Minović, J., 2012. Liquidity of the Croatian Stock Market: An Empirical Analysis. Economic research-Ekonomska istraživanja, 25(3), pp. 776-802 [ CrossRef]
Pástor, L. and Stambaugh, R. F., 2003. Liquidity risk and expected stock returns. Journal of Political economy, 111(3), pp. 642-685 [ CrossRef]
Reese Jr., W. A., 1998. Capital gains taxation and stock market activity: Evidence from IPOs. The Journal of Finance, 53(5), pp. 1799-1819 [ CrossRef]
Repetti, J. R., 1989. The Use of Tax Law to Stabilize the Stock Market: The Efficacy of Holding Period Requirements. Virginia Tax Review, 8, pp. 591-637.
Rubin, D. B., 1974. Estimating causal effects of treatments in randomized and nonrandomized studies. Journal of Educational Psychology, 66(5), pp. 688-701 [ CrossRef]
Shackefold, D. A., 2000. Stock Market Reaction to Capital Gains Tax Changes: Empirical Evidence from the 1997 and 1998 Tax Acts. Tax Policy and the Economy, 14, pp. 67-92 [ CrossRef]
Sheskin, D. J., 1997. Parametric and Nonparametric Statistical Procedures. Boca Raton: CRC Press.
Škrinjarić, T., 2018. Revisiting herding investment behaviour on Zagreb Stock Exchange: a quantile regression approach. Econometric Research in Finance, 3(1), pp. 119-162 [ CrossRef]
Slemrod, J., 1982. Stock transactions volume and the 1978 capital gains tax reduction. Public Finance Quarterly, 10(1), pp. 3-16 [ CrossRef]
Stoica, O. and Diaconasu, D., 2011. An Examination of the Calendar Anomalies on Emerging Central and Eastern European Stock Markets. Recent Researches in Applied Economics, 11, pp. 116-121.
Varian, H. R., 1989. Differences of Opinion in Financial Markets, Financial Risk Theory, Evidence and I Implications. Proceedings of the 11th Annual Economic Policy Conference of the Federal Reserve Bank of St. Louis. Boston: Kluwer [ CrossRef]
Vidović, J., 2013. Investigation of stock illiquidity on Central and South East European markets in naïve portfolio framework. Economic thought and practice-Ekonomska misao i praksa, 2, pp. 537-550.
Vidović, J., Poklepović, T. and Aljinović, Z., 2014. How to Measure Illiquidity on European Emerging Stock Markets?. Business Systems Research: International journal of the Society for Advancing Innovation and Research in Economy, 5(3), pp. 67-81 [ CrossRef]
Xu, P., Rui, O. M. and Kim, S., 2002. Risk Shift Following Dividend Change Announcement: The Role of Trading. Review of Quantitative Finance and Accounting, 19, pp. 45-63.
Yadav, P. K. 1992. Event studies based on volatility of returns and trading volume: A review. The British Accounting Review, 24(2), pp. 157-184 [ CrossRef]
|
|
|
September, 2020
III/2020
|


