3377
Views
286
Downloads |
A cost-of-living squeeze? Distributional implications of rising inflation
Orsetta Causa*
 Orsetta Causa
Affiliation:
Orsetta Causa
Affiliation: OECD Economics Department, Paris, France
Emilia Soldani* 
Chiara Soriolo*
Chiara Soriolo
Affiliation: Compass Lexecon
Article | Year: 2023 | Pages: 431 - 460 | Volume: 47 | Issue: 4 Received: March 14, 2023 | Accepted: September 11, 2023 | Published online: December 11, 2023
|

FULL ARTICLE
FIGURES & DATA
REFERENCES
CROSSMARK POLICY
METRICS
LICENCING
PDF
Note: Year on year energy price inflation for Turkey: 132.76 per cent. Source: OECD (2013a).
Note: Distribution based on household income (see annex for country-specific income measurement). Energy refers to energy from housing and private transportation. Food includes food and non-alcoholic beverages, with the exception of Mexico, where it also includes alcoholic beverages consumed at home. When possible, expenditure shares are shown by income deciles (for Mexico and the United Kingdom) or quintiles (the Czech Republic, Japan, United States). In the case of Germany, the data can only be obtained by the income groups defined by DEStatis (indicated as G1,…G6). Source: National HBS sources (see annex).
Note: For France, “small cities” are defined as those below 20,000 inhabitants, “medium cities” range between 20,000 and 100,000 inhabitants, “big cities” have more than 100,000 inhabitants. For the U.S., the classification in rural, urban and central city areas is provided by BLS-CEX. Source: National HBS. See annex.
Note: How to read: in Italy, the average household experienced a 10.2% decline in purchasing power following changes in consumer prices between August 2021 and August 2022. This is driven by three effects: the effect of changes in energy prices (a 5.3% decline in purchasing power), the effect of changes in food prices (a 2.8% decline in purchasing power) and the effect of changes in non-energy non-food consumer prices (a 2.1% decline in purchasing power). Source: National HBS and CPI. See annex.
Note: How to read: in the United Kingdom, the decline in purchasing power following changes in consumer prices between August 2021 and August 2022 was 3.1 percentage points (pp) higher for low- than for high-income households (a negative 3.1 pp gap). This total gap is driven by three effects: the effect of changes in energy prices (a negative 2.9 pp gap), the effect of changes in food prices (a negative 1 pp gap) and the effect of changes in non-energy non-food consumer prices (a positive 0.8 gap). Due to limited data availability, Mexico cannot be covered in panels B and C, and Germany in panel B. See annex for country-specific definitions of high- versus low-income, rural versus metropolitan, and senior versus prime-aged households (age always refers to that of the household reference person). Source: National HBS and CPI. See annex.
Note: The chart shows the change in purchasing power between August 2021 and August 2022. How to read: in Denmark, households living in rural areas experienced a 6% decline in purchasing power, low-income households a 5.3% decline in purchasing power and senior households a 5% decline in purchasing power following changes in energy prices between August 2021 and August 2022. Source: National HBS and CPI. See annex.
Note: For Germany, “Housing” includes imputed rental costs. See annex for details. Source: National HBS and CPI. See annex.
|
Country
|
Data source for
CPI
|
Treatment of housing
|
|
CZE
|
OECD CPI
|
Actual rents
|
|
DEU
|
OECD CPI for the baseline.
Destatis CPI by COICOP 2-5-digit hierarchy. Table 61111-0004 for the granular
extension.
|
Actual and imputed rents
|
|
DNK
|
OECD CPI
|
Actual rents
|
|
ESP
|
OECD CPI
|
Actual rents
|
|
FRA
|
OECD CPI for the baseline.
Insee CPI by COICOP 2-5-digit hierarchy for the granular extension.
|
Actual rents
|
|
ITA
|
OECD CPI for the baseline.
ISTAT Harmonized index of consumer prices for the granular extension.
|
Actual rents
|
|
JPN
|
Statistics Bureau of Japan.
|
Actual rents
|
|
MEX
|
OECD CPI
|
Actual and imputed rents
|
|
GBR
|
OECD CPI for the baseline.
ONS Harmonized index of consumer prices for the granular extension.
|
Actual rents
|
|
USA
|
Bureau of Labour Statistics.
|
Actual and imputed rents
|
|
Country
|
HBS year
|
HBS data
sources
|
Energy
consumption categories
(COICOP codes)
|
Treatment of
housing
|
|
CZE
|
2020
|
Czech Statistical Office – Household Budget Survey
|
04.5 + 07.2.2
|
Actual rents
|
|
DEU
|
2020
|
Destatis – Laufende
Wirtschaftsrechnungen Einkommen Einnamhen und Ausgaben privater Haushalte
|
Housing energy („Energie”)
+ 07.2.2
|
Actual and imputed
rents. Housing does not include the category „Water supply, misc. services
related to the dwelling“
|
|
DNK
|
2020
|
Statistics Denmark –
Household Budget Survey
|
04.5 + 07.2 (data for 07.2.2 not available)
|
Actual rents
|
|
ESP
|
2020
|
National Institute of
Statistics – Household Budget Survey
|
04.5 + 07.2 (data for
07.2.2 not available)
|
Actual rents
|
|
FRA
|
2017
|
National Institute of
Statistics and Economic Studies – Enquete Budget de Famille
|
04.5 + 07.2.2
|
Actual rents
|
|
ITA
|
2020
|
National Institute of
Statistics – Indagine sulle spese delle famiglie
|
04.5 + 07.2.2
|
Actual and imputed
rents
|
|
JPN
|
2020
|
Statistics Bureau of
Japan – Family Income and Expenditure Survey
|
Housing energy („Fuel,
light & water charges“ excluding „Water and sewerage charges“)
|
Actual rents
|
|
MEX
|
2020
|
INEGI
– Encuesta Nacional de Ingresos y Gastos de los Hogares
|
Housing energy („Electricidad
y combustibles“) and Transports energy („Refacciones, partes, accesorios,
mantenimiento, combustibles y servicio para vehículos“)
|
Actual and imputed
rents
|
|
GBR
|
2020
|
Office for National
Statistics – Living Cost and Food Survey
|
Housing energy („Electricity,
gas and other fuels“) and transport energy („Petrol, diesel and other motor
oil“)
|
Actual rents
|
|
USA
|
2020
|
Bureau of Labour
Statistics – Consumer Expenditure Survey
|
Housing energy („Utilities,
fuels, and public services“ excluding „Telephone services“ and „Water and
other public services“) and Transport energy („Gasoline, other fuels, and
motor oil“)
|
Actual and imputed
rents
|
Source: National Statistical Offices.
|
Country
|
Income definition
|
Income categories
|
|
CZE
|
Net money income per person
|
Quintiles
|
|
DEU
|
Net monthly household
income
|
Up to 1,300 euro, From
1,300 to 1,700 euro, From 1,700 to 2,600 euro, From 2,600 to 3,600 euro, From
3,600 to 5,000 euro, 5,000 euro or more
|
|
DNK
|
Household annual total
income
|
Up to 250,000 DKK, From
250,000 to 449,999 DKK, From 450,000 to 699,999 DKK, From 700,000 to 999,999 DKK,
1,000,000 DKK or more
|
|
ESP
|
Monthly net household
income
|
Up to 499 euro, From 500
to 999 euro, From 1,000 to 1,499 euro, From 1,500 to 1,999 euro, From 2,000 to
2,499 euro, From 2,500 to 2,999 euro, From 3,000 to 4,999 euro, 5,000 euro or
more
|
|
FRA
|
Equivalized household
disposable income
|
Deciles
|
|
ITA
|
Income proxied by education
|
Lower secondary, Upper
secondary, Tertiary education
|
|
JPN
|
Annual household income
|
Quintiles
|
|
MEX
|
Quarterly total household
income
|
Deciles
|
|
GBR
|
Equivalized household
disposable income
|
Deciles
|
|
USA
|
Income before taxes, defined
as the combined income of all consumer unit members (14 years of age or over)
during the 12 months preceding the interview
|
Quintiles
|
|
Country
|
Definition basis
for rural and metropolitan areas
|
Rural
|
Metropolitan
|
|
CZE
|
Number of inhabitants
|
Less than 1,999 inhabitants
|
More than 50,000 inhabitants
|
|
DNK
|
Population density &
Eurostat regional classification
|
Nordjylland
|
Hovedstaden
|
|
ESP
|
Number of inhabitants
|
Less than 10,000 inhabitants
|
100,000 or more inhabitants
|
|
FRA
|
INSEE-HBS classification
directly available
|
Rural
|
Paris complex
|
|
ITA
|
ISTAT-HBS classification
directly available
|
Other municipalities up
to 50,000 inhab. (different from metropolitan area suburbs)
|
Metropolitan area - centre
|
|
JPN
|
Statistics Bureau of Japan
classification directly available
|
Small cities, towns and
villages
|
Major cities
|
|
GBR
|
Population density and
Eurostat regional classification
|
North-East
|
London
|
|
USA
|
BLS-CEX
classification directly available
|
Rural
|
Central city
|
|
Country
|
Age definition
|
Senior
|
Prime-age
|
|
CZE
|
Labour market status as
a proxy for age
|
Pensioner
|
Employed
|
|
DEU
|
Age of the household head
or reference person
|
65 to 69 years old
|
35 to 44 years old
|
|
DNK
|
Age of the household head
|
60 to 74 years old
|
35 to 44 years old
|
|
ESP
|
Age of the household head
|
65 and over
|
35 to 44 years old
|
|
FRA
|
Age of the household head
|
65 to 74 years old
|
35 to 44 years old
|
|
ITA
|
Labour market status as
a proxy for age
|
Retired
|
Employed
|
|
JPN
|
Age of the household head
|
65 and over
|
30 to 39 years old
|
|
GBR
|
Age of the household head
|
65 to 74 years old
|
30 to 49 years old
|
|
USA
|
Age of the household head
|
65 to 74 years old
|
35 to 44 years old
|
Source: National Statistical Offices.
|
|
2019
|
2020
|
|
Description
|
Low
|
High
|
Delta
|
Low
|
High
|
Delta
|
|
Food and non-alcoholic drinks
|
20.09
|
16.58
|
3.51
|
22.57
|
17.53
|
5.04
|
|
Alcoholic drink, tobacco and
narcotics
|
2.72
|
2.81
|
-0.09
|
3.06
|
3.01
|
0.05
|
|
Clothing and footwear
|
4.59
|
5.18
|
-0.59
|
4.73
|
4.89
|
-0.16
|
|
Housing, fuel and power
|
25.00
|
22.20
|
2.80
|
25.10
|
22.72
|
2.38
|
|
of which Electricity, gas
and other fuels
|
11.20
|
9.95
|
1.25
|
9.89
|
9.17
|
0.72
|
|
Household goods and services
|
5.82
|
6.57
|
-0.75
|
5.70
|
8.34
|
-2.65
|
|
Health
|
2.43
|
2.74
|
-0.31
|
2.76
|
2.81
|
-0.05
|
|
Transport
|
10.23
|
11.55
|
-1.33
|
9.31
|
11.49
|
-2.18
|
|
of which Fuels and lubricants
for personal transport equipment
|
4.46
|
4.76
|
-0.30
|
3.99
|
3.96
|
0.04
|
|
Communication
|
4.50
|
4.21
|
0.29
|
4.75
|
4.14
|
0.61
|
|
Recreation and culture
|
9.97
|
11.00
|
-1.03
|
9.04
|
9.78
|
-0.73
|
|
Education
|
1.53
|
1.25
|
0.28
|
1.15
|
0.69
|
0.45
|
|
Restaurants and hotels
|
7.00
|
7.25
|
-0.25
|
5.34
|
6.65
|
-1.31
|
|
Miscellaneous goods and services
|
6.12
|
8.65
|
-2.53
|
6.50
|
7.95
|
-1.45
|
Source: Czech Statistical Office.
|
|
2019
|
2020
|
|
Description
|
Low
|
High
|
Delta
|
Low
|
High
|
Delta
|
|
Food and non-alcoholic
drinks
|
12.18
|
11.14
|
1.05
|
12.37
|
11.53
|
0.84
|
|
Alcoholic
drink, tobacco and narcotics
|
2.66
|
1.84
|
0.82
|
2.84
|
1.97
|
0.87
|
|
Clothing and
footwear
|
3.54
|
4.05
|
-0.51
|
4.38
|
3.42
|
0.95
|
|
Housing, fuel
and power
|
42.14
|
29.22
|
12.92
|
43.23
|
28.75
|
14.48
|
|
of which Electricity,
gas and other fuels
|
10.64
|
5.54
|
5.10
|
9.61
|
4.95
|
4.66
|
|
Household
goods and services
|
4.13
|
5.32
|
-1.18
|
4.57
|
6.06
|
-1.49
|
|
Health
|
3.04
|
2.06
|
0.98
|
3.08
|
2.28
|
0.81
|
|
Transport
|
8.33
|
16.05
|
-7.72
|
7.22
|
17.57
|
-10.35
|
|
of which Operation
of personal transport equipment
|
3.75
|
7.80
|
-4.05
|
3.43
|
7.80
|
-4.37
|
|
Communication
|
2.90
|
2.07
|
0.83
|
3.32
|
2.10
|
1.22
|
|
Recreation
and culture
|
8.48
|
10.80
|
-2.33
|
7.83
|
10.48
|
-2.65
|
|
Education
|
0.57
|
0.95
|
-0.38
|
0.61
|
0.84
|
-0.22
|
|
Restaurants
and hotels
|
5.32
|
7.35
|
-2.03
|
3.95
|
5.48
|
-1.53
|
|
Miscellaneous
goods and services
|
6.71
|
9.15
|
-2.44
|
6.61
|
9.52
|
-2.92
|
|
|
2019
|
2020
|
|
Description
|
Low
|
High
|
Delta
|
Low
|
High
|
Delta
|
|
Food and non-alcoholic drinks
|
20.22
|
13.69
|
6.53
|
22.37
|
15.98
|
6.39
|
|
Alcoholic drink, tobacco and
narcotics
|
2.19
|
1.37
|
0.82
|
2.20
|
1.56
|
0.65
|
|
Clothing and footwear
|
4.27
|
5.04
|
-0.77
|
3.72
|
4.41
|
-0.69
|
|
Housing, fuel and power
|
34.34
|
34.65
|
-0.30
|
37.19
|
38.66
|
-1.46
|
|
of which Electricity, gas
and other fuels
|
5.09
|
3.38
|
1.71
|
5.22
|
3.59
|
1.63
|
|
Household goods and services
|
4.00
|
4.81
|
-0.81
|
4.11
|
5.03
|
-0.92
|
|
Health
|
4.61
|
4.12
|
0.49
|
4.53
|
4.21
|
0.32
|
|
Transport
|
11.65
|
12.00
|
-0.35
|
9.63
|
9.46
|
0.17
|
|
of which Fuels and lubricants
for personal transport equipment
|
5.57
|
4.35
|
1.22
|
4.74
|
3.40
|
1.34
|
|
Communication
|
2.54
|
1.96
|
0.58
|
2.55
|
2.06
|
0.50
|
|
Recreation and culture
|
4.32
|
6.20
|
-1.88
|
3.54
|
5.11
|
-1.57
|
|
Education
|
0.45
|
1.05
|
-0.59
|
0.41
|
1.01
|
-0.60
|
|
Restaurants and hotels
|
4.24
|
6.87
|
-2.63
|
2.88
|
4.43
|
-1.55
|
|
Miscellaneous goods and services
|
7.16
|
8.26
|
-1.10
|
6.87
|
8.09
|
-1.22
|
Note: High-income and low-income categories are proxied by high-education and low-education. Source: ISTAT.
|
|
2019
|
2020
|
|
Description
|
Low
|
High
|
Delta
|
Low
|
High
|
Delta
|
|
Food
|
28.28
|
22.85
|
5.43
|
28.66
|
24.94
|
3.72
|
|
Housing
|
20.30
|
10.87
|
9.43
|
20.94
|
12.01
|
8.93
|
|
of which Fuel & light
|
8.23
|
4.47
|
3.76
|
8.21
|
4.78
|
3.43
|
|
Furniture & household
utensils
|
3.73
|
3.65
|
0.08
|
4.20
|
4.44
|
-0.23
|
|
Clothing & footwear
|
2.82
|
4.45
|
-1.64
|
2.42
|
4.01
|
-1.59
|
|
Medical care
|
5.74
|
4.05
|
1.69
|
5.80
|
4.41
|
1.39
|
|
Transportation & communication
|
10.99
|
15.57
|
-4.59
|
10.69
|
14.72
|
-4.03
|
|
Education
|
0.27
|
6.08
|
-5.80
|
0.30
|
5.83
|
-5.53
|
|
Culture & recreation
|
9.61
|
11.15
|
-1.54
|
8.82
|
9.50
|
-0.68
|
|
Other consumption expenditures
|
18.27
|
21.33
|
-3.06
|
18.16
|
20.15
|
-1.98
|
Source: Statistics Bureau of Japan.
|
|
2019
|
2020
|
|
Description
|
Low
|
High
|
Delta
|
Low
|
High
|
Delta
|
|
Food and non-alcoholic drinks
|
45.12
|
15.35
|
29.76
|
46.15
|
22.19
|
23.96
|
|
Alcoholic drink, tobacco and
narcotics
|
0.20
|
0.17
|
0.03
|
0.19
|
0.18
|
0.02
|
|
Clothing and footwear
|
3.61
|
4.90
|
-1.28
|
2.22
|
3.44
|
-1.22
|
|
Housing, fuel and power
|
10.20
|
8.58
|
1.62
|
12.69
|
9.79
|
2.90
|
|
of which Electricity, gas and other fuels
|
5.58
|
3.14
|
2.44
|
5.80
|
4.06
|
1.74
|
|
Household goods and services
|
6.58
|
7.05
|
-0.47
|
6.45
|
7.88
|
-1.43
|
|
Health
|
2.60
|
3.09
|
-0.49
|
4.17
|
5.08
|
-0.91
|
|
Transport
|
9.96
|
17.58
|
-7.62
|
8.20
|
14.79
|
-6.59
|
|
of which Fuels and lubricants for personal
transport equipment
|
2.25
|
9.56
|
-7.31
|
2.65
|
8.91
|
-6.26
|
|
Communication
|
2.34
|
4.70
|
-2.36
|
3.58
|
5.51
|
-1.93
|
|
Recreation and culture
|
1.47
|
5.90
|
-4.42
|
1.19
|
2.37
|
-1.18
|
|
Education
|
4.35
|
11.07
|
-6.72
|
2.43
|
9.79
|
-7.36
|
|
Restaurants and hotels
|
4.64
|
9.88
|
-5.24
|
3.86
|
6.11
|
-2.25
|
|
Miscellaneous goods and services
|
7.45
|
7.49
|
-0.04
|
7.62
|
8.23
|
-0.61
|
|
Other expenditure items
|
1.46
|
4.24
|
-2.78
|
1.23
|
4.63
|
-3.40
|
Note: 2019 not available. Source: National Institute of Statistics and Geography.
|
|
2019
|
2020
|
|
Description
|
Low
|
High
|
Delta
|
Low
|
High
|
Delta
|
|
Food and non-alcoholic drinks
|
17.17
|
10.37
|
6.80
|
19.95
|
13.28
|
6.67
|
|
Alcoholic drink, tobacco and
narcotics
|
2.60
|
1.25
|
1.35
|
2.17
|
1.29
|
0.88
|
|
Clothing and footwear
|
3.20
|
5.14
|
-1.94
|
2.01
|
4.16
|
-2.15
|
|
Housing, fuel and power
|
45.80
|
27.36
|
16.13
|
48.80
|
32.02
|
14.49
|
|
of which Electricity, gas and other fuels
|
5.20
|
2.89
|
2.31
|
5.51
|
3.22
|
2.29
|
|
Household goods and services
|
2.99
|
6.41
|
-3.42
|
2.83
|
6.62
|
-3.79
|
|
Health
|
2.07
|
3.23
|
-1.16
|
2.66
|
3.15
|
-0.49
|
|
Transport
|
6.03
|
13.90
|
-6.31
|
5.00
|
10.81
|
-4.79
|
|
of which Operation of personal transport
equipment
|
4.85
|
6.41
|
-1.56
|
4.27
|
5.29
|
-1.02
|
|
Communication
|
3.50
|
2.28
|
1.22
|
4.00
|
2.69
|
1.31
|
|
Recreation and culture
|
2.65
|
6.62
|
-3.97
|
1.91
|
4.51
|
-2.60
|
|
Education
|
n.a
|
3.52
|
n.a
|
n.a
|
4.42
|
n.a
|
|
Restaurants and hotels
|
4.23
|
12.30
|
-8.07
|
1.79
|
9.06
|
-7.27
|
|
Miscellaneous goods and services
|
6.42
|
7.45
|
-1.03
|
5.51
|
7.88
|
-2.37
|
Note: Data on education spending share not available for low-income households. Source: National Institute of Statistics.
|
|
2019
|
2020
|
|
Description
|
Low
|
High
|
Delta
|
Low
|
High
|
Delta
|
|
Food and non-alcoholic drinks
|
13.90
|
7.20
|
6.70
|
15.00
|
7.40
|
7.60
|
|
Alcoholic drink, tobacco and
narcotics
|
3.40
|
1.70
|
1.70
|
3.20
|
1.70
|
1.50
|
|
Clothing and footwear
|
4.20
|
3.80
|
0.40
|
4.20
|
3.90
|
0.30
|
|
Housing, fuel and power
|
21.90
|
9.20
|
12.70
|
21.70
|
10.40
|
11.30
|
|
of which Electricity, gas
and other fuels
|
7.30
|
2.80
|
4.50
|
7.60
|
2.70
|
4.90
|
|
Household goods and services
|
6.30
|
9.00
|
-2.70
|
5.40
|
6.50
|
-1.10
|
|
Health
|
1.20
|
1.20
|
0.00
|
0.90
|
1.60
|
-0.70
|
|
Transport
|
11.20
|
15.40
|
-4.20
|
10.10
|
14.50
|
-4.40
|
|
of which Operation of personal
transport equipment
|
3.20
|
3.10
|
0.10
|
3.40
|
2.70
|
0.70
|
|
Communication
|
4.20
|
2.50
|
1.70
|
4.50
|
2.60
|
1.90
|
|
Recreation and culture
|
9.80
|
13.50
|
-3.70
|
10.70
|
14.00
|
-3.30
|
|
Education
|
0.40
|
2.00
|
-1.60
|
n.a
|
1.40
|
n.a
|
|
Restaurants and hotels
|
6.80
|
9.90
|
-3.10
|
7.40
|
10.00
|
-2.60
|
|
Miscellaneous goods and services
|
6.50
|
7.70
|
-1.20
|
6.60
|
7.90
|
-1.30
|
|
Other expenditure items
|
10.10
|
16.90
|
-6.80
|
10.20
|
18.20
|
-8.00
|
Note: Data on education spending share not available for low-income households in 2020. Source: Office for National Statistics.
|
|
2019
|
2020
|
|
Description
|
Low
|
High
|
Delta
|
Low
|
High
|
Delta
|
|
Food at home
|
9.73
|
5.86
|
3.87
|
10.79
|
6.81
|
3.98
|
|
Alcoholic
beverages and Tobacco
|
1.77
|
1.20
|
0.57
|
1.50
|
1.19
|
0.31
|
|
Apparel and
services
|
2.85
|
2.94
|
-0.08
|
2.65
|
2.46
|
0.20
|
|
Housing
|
36.93
|
26.36
|
10.57
|
39.65
|
27.59
|
12.05
|
|
of which Utilities
and fuels
|
4.80
|
2.27
|
2.53
|
5.26
|
2.38
|
2.88
|
|
Household
furnishings and equipment
|
3.29
|
3.50
|
-0.21
|
3.23
|
4.32
|
-1.08
|
|
Healthcare
|
9.96
|
6.92
|
3.04
|
9.66
|
6.91
|
2.75
|
|
Transport
|
15.98
|
15.77
|
0.21
|
15.19
|
14.63
|
0.56
|
|
of which Gasoline,
other fuels, and motor oil
|
3.48
|
2.63
|
0.85
|
2.84
|
1.91
|
0.93
|
|
Personal care
products and services
|
1.27
|
1.16
|
0.11
|
1.05
|
1.02
|
0.03
|
|
Entertainment
and Reading
|
4.08
|
5.74
|
-1.66
|
4.39
|
5.35
|
-0.96
|
|
Food away
from home
|
5.62
|
5.64
|
-0.03
|
3.48
|
3.85
|
-0.37
|
|
Education
|
2.68
|
3.35
|
-0.67
|
2.22
|
3.09
|
-0.88
|
|
Miscellaneous
|
1.43
|
1.38
|
0.05
|
1.46
|
1.37
|
0.09
|
|
Personal insurance
and pensions
|
2.16
|
16.34
|
-14.18
|
2.12
|
17.37
|
-15.25
|
|
Cash contribution
and personal insurance and pensions
|
2.26
|
3.83
|
-1.57
|
2.61
|
4.05
|
-1.43
|
Source: Bureau of Labour Statistics.
Source: OECD calculations based on National HBS and CPI.
|
|
|
Abstract
In most OECD countries inflation sharply increased since the end of 2021, mostly driven by energy and food prices. Certain categories of households are particularly vulnerable, as they spend large portions of their consumption on energy and food. Drawing on national micro-based household budget survey data, this paper quantifies the impact of rising prices on households’ welfare. Declines in household purchasing power between August 2021 and August 2022 are estimated to range from 3% in Japan to 18% in Czechia. This decline is driven by energy prices in most countries, especially Denmark, Italy, and the United Kingdom. In general, inflation weighs relatively more on lower income households. The effects are stronger for rural households, due to energy price inflation. These findings call for a careful targeting of income and price support measures, notwithstanding their administrative and logistical complexity, taking into account their effects on economic activity, inflation, and environmental goals.
Keywords: inflation; purchasing power; distribution; inequality; energy; policy analysis
JEL: H12, H23, I3, Q41, Q48
1 Introduction
Inflation in the OECD has been on the rise since the start of 2021, intensifying sharply following Russia’s war of aggression against Ukraine. Soaring energy and, to a lesser extent, food prices are a global phenomenon, yet the inflationary picture differs across countries (figure 1).
Figure 1Consumer price inflation across OECD countries, change between August 2021 and August 2022 (%) DISPLAY Figure
This paper looks at the distributional impact of rising inflation 1 over the past year, with a focus on energy and, to a lesser extent, food price inflation, for ten OECD countries selected on the basis of adequate and timely data availability, i.e., the Czech Republic, Denmark, Germany, France, Italy, Japan, Mexico, Spain, the United Kingdom and the United States. The exercise draws on national microbased household budget surveys (HBS) providing information on the structure of household spending across the distribution of households based on income, age, and area of residence, depending on data availability. This paper associates expenditure shares from national HBS with price changes from national CPIs.
This work informs the policy debate by identifying households more exposed and vulnerable to the recent rise in inflation and in particular to changes in energy prices, which in the future might also fluctuate as we move along the path to a low-carbon economy (IEA,  2021 2021). The main findings can be summarised as follows: - Rising prices, especially for energy, have been squeezing households’ purchasing power, but with large differences across countries, partly reflecting differences in the rate of inflation, its breadth across consumer items and the spending structure of the average household.
- Low-income, rural and senior households are more exposed to rising energy prices than the average household, but the variation in purchasing power losses across these three vulnerable groups is highly heterogeneous across countries.
- The difference in estimated energy prices effects between rural and urban areas are even larger than between lower and higher income households in most countries, and especially in Czechia, Spain, and France.
- Non-energy non-food-price inflation tends to be progressive, thus somewhat mitigating, but not offsetting the effect of rising energy and food prices. This reflects the fact that “other” rising consumer prices correspond to items representing a higher share of spending for more affluent households, i.e., nonenergy transport, recreation, restaurants and hotels.
- Improving the timeliness and granularity of the data would help in the designing of well-targeted policy support: for instance, to identify households most exposed to shifts in energy prices, e.g. those with limited financial resources and possibilities to substitute in the short-run. The digital transformation is the opportunity to build agile targeting instruments based on data collection and management.
The rest of this paper is structured as follows. Section 1 provides an overview of the data and empirical approach – additional methodological aspects are provided in the annex. Section 2 delivers the core results of the analysis, i.e., it sheds light on the distributional effects of the recent rise in inflation, with a focus on energy and food driven price inflation across a selection of OECD countries. The emphasis is on differences across income groups, but alternative relevant dimensions are also explored. This evidence is followed by a short policy discussion on key policy challenges to achieve effective targeted support for households most vulnerable to energy price swings while pursuing decarbonisation objectives.
2 The approach
2.1 Data and country coverage
The analysis draws on household budget surveys, which are national surveys on households’ expenditure on goods and services. Countries covered are those for which data are available and are as up to date as possible. Harmonised Eurostat HBS data for European countries would have been well-suited for this exercise but are not up to date, only being updated every five years. The following ten countries can be covered, with HBS data available for the year 2020 (with the exception of France): the Czech Republic, Denmark, France, Germany, Italy, Japan, Mexico, Spain, UK, US.2
2.2 Methodology
Distributional effects of inflation are assessed based on household exposure to the change in the prices of the items that make up households’ consumption baskets. This is expressed in terms of change in purchasing power following the conceptual framework of the compensating variation approach (Deaton, 1989). The compensating variation (CV) measures how much expenditure can be decreased (increased) when consumer prices fall (rise) so that the utility level remains the same as before the price decrease (increase). For household i, the CV is measured relative to total household expenditure (Ci). This is a measure of the change in household purchasing power resulting from changes in consumer prices underlying inflation; that is, the price change in item k (indicated as  ) weighted by the share of expenditure that is spent on item k (scik,), defined as ) weighted by the share of expenditure that is spent on item k (scik,), defined as  , where pk and qik refer, respectively, to consumption item k’s price and to the quantity purchased by household i, and ci refers to the household’s total expenditure , where pk and qik refer, respectively, to consumption item k’s price and to the quantity purchased by household i, and ci refers to the household’s total expenditure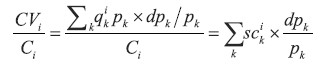 | (1) |
This approach has been used to assess the distributional effects of consumption taxes (OECD/KIPF, 2014) and of trade-driven price changes (Luu et al., 2020; Porto, 2006). The change in purchasing power can be computed for the average household and by income or other socioeconomic groups defined by, e.g. age, education and urbanisation of the area of residence, depending on data availability. For the purpose of the current exercise, the analysis relies on semi-aggregated data provided by national sources, that is, expenditure shares by socioeconomic groups.
The CV for household i corresponds to the average of the percentage changes in prices across categories of expenditures, weighted by the household’s expenditure share on each category. This is close, but not equal, to the inflation rate, i.e., percentage change in CPI, for household i, which would be the percent change in the average of prices across categories of expenditures, weighted by the household’s expenditure shares. The CV approach is adopted here because it has a conceptually-grounded economic interpretation for the purpose of the current exercise, similar to previous papers on distributional aspects of consumer price changes. In addition, the CPI calculations rely on weights that are adjusted according to consumption estimates from national accounts, with country-specific frequencies and methodologies (OECD, 2023a). Given the focus on distributional effects and for internal consistency, the current exercise uses the original expenditures shares from domestic HBS surveys, including those for the average household. 3
The analysis uses 2020 household expenditure shares to assess the impact of inflation over the past year, 4 consistent with the standard CPI methodology: national CPIs are constructed as weighted averages of sub-indices covering different products in the consumption basket, using the total household expenditure shares of a base year, as weights. These weights are regularly updated 5 and, in normal times, are very stable. 6
To introduce the exercise, figure 2 reports expenditure shares on energy and food across the household income distribution for the Czech Republic, Germany, Japan, Mexico, the United Kingdom, and the United States. 7 The main insights are: - Households devote a significant share of their spending to food and energy, and this share declines with increasing income level. Their combined spending share ranges from more than 30 per cent at the bottom to less than 15 per cent at the top of the income distribution, across the advanced economies covered here, yet with large cross-country differences within that broad spectrum.
- Food is a major component of the consumption basket. Low-income households spend around 20 per cent on food in the advanced economies covered by this paper with the notable exception of the United States, where that share is around 10 per cent. In line with Engels’ law, the weight of food is larger in Mexico, where low-income households devote approximately half of their spending on food and high-income ones 30 per cent.
- Energy represents around 10 per cent of household spending in most of the countries covered and this share declines across the income distribution. Mexico stands out as energy represents a much higher share of spending and this share increases across the income distribution. The share of consumption spent on energy is highest in the Czech Republic and lowest in Japan and the United States. Such cross-country differences likely reflect differences both in relative prices and in consumption patterns.
Figure 2Shares of expenditure on energy and food, by income group (%) DISPLAY Figure
Differences in energy spending are more pronounced across place of residence than across households’ incomes. This is illustrated in panel A of figure 3 with France and the United States. For example in France, people living in rural areas devote around 12 per cent of their budget to energy, more than twice as much as people living in the Paris agglomeration. It is often the case that people living in metropolitan areas have diverse commuting and mobility options, including public transportation, walking, biking, and while people living in rural or non-central areas may have no other option than driving a personal car (for example to go to work or the doctor). Differences in energy spending by age are less systematic across countries than they are by income and place of residence: taking again France and the United States as examples, panel B of figure 3 shows that the share of spending devoted to energy increases almost monotonically with age in France, but not in the United States. 8
3 The results
3.1 The big picture: the cost-of-living pressure for the average household
Rising prices, especially for energy, have been squeezing households’ purchasing power, yet with large differences reflecting differences in the rate of inflation, its breadth across consumer items, and the spending structure of the average household.9 The main findings on the basis of year-on-year August 2021 – August 2022 inflation are (figure 4):- Declines in households’ purchasing power range from around 3% in Japan to 18% in the Czech Republic.10
- The effect of rising energy prices is large but differs across countries, being particularly important in Italy, Denmark and the United Kingdom.
- Rising food prices weigh less than rising energy prices on the purchasing power of the average household. Mexico is an exception given the high share of food in the consumption basket and the relatively mild increase in energy prices over the period.
- The effect of “non-food-non-energy” prices on the average household’s purchasing power is relatively higher in countries like the Czech Republic and the United States, reflecting the fact that inflation in these countries was more broad-based.
- These differences across countries are in part due to differences in the relative price changes and in part to differences in the consumption share allocated to food, energy and the residual category.
Figure 3Expenditure shares on energy (%) DISPLAY Figure
These results are subject to two main caveats: (1) the computations include the purchasing power effects of price-based policy interventions, e.g., reduced prices or taxes on electricity, gas and gasoline; they do not include the purchasing power effects of non-price-based policy interventions, e.g. income support via cash transfers or reduced income taxes. This might affect the cross-country comparison exercise, in light of differences in the adopted mitigation measures. In general, at least during 2022, price support measures introduced to contrast the cost-of-living crisis following Russia’s attack on Ukraine outnumbered and involved higher costs than income support measures (OECD, 2022). Evidence for France and the United States suggests that the combined effect of these measures has been effective in supporting the purchasing power of vulnerable households (Madec, Plane and Sampognaro, 2022; CBO, 2022). The current calculations can therefore be interpreted as measures of potential exposure to purchasing power losses, abstracting from the mitigation achieved through ad hoc income support measures. (2) energy effects are to be taken as a lower-bound, given that energy items are key intermediate inputs for the production of non-energy items, and therefore for the pass-through to non-energy consumer items (see Ari et al. ( 2022), and OECD ( 2023b) for a quantification exercise of direct and indirect effects from rising energy prices). 11
Figure 4Purchasing power changes for the average household (%) DISPLAY Figure
3.1.1 Beyond the average household: distributional effects of the cost-of-living pressure
The effects of inflation are highly heterogeneous across households and distributional patterns differ across countries (figure 5). A comparison of low- and high-income households (defined as first and last decile, quintile, or country-specific threshold of the household income distribution, see annex) yields the following insights (figure 5, panel A).
Inflation has a greater impact on low than high-income households, but with marked differences across countries. Nevertheless, such differences do not appear to be strongly correlated with the level of inflation in the country. The gap between low and high-income households is the largest in the United Kingdom while it is almost absent in the Czech Republic and Denmark despite similar or even higher headline inflation over the period covered.
Energy price inflation is strongly regressive in all countries except Mexico, where it has a relatively higher effect on high-income households; this is consistent with the fact that in Mexico the share of spending on energy is positively associated with household income (figure 2). 12
Food price inflation is also regressive but less so than energy price inflation in most countries covered. Mexico stands out, again, since food price inflation is the single major driver of regressivity. The regressivity of the effects of food price inflation is also more marked than that of energy price inflation in the Czech Republic and Spain.
The effect of non-food non-energy price inflation is progressive, i.e., affecting high- more than low-income households, which is why the total gap is lower than the sum of the energy and food gaps.
Living on limited income resources is not the only and often not the first factor of vulnerability to the current inflationary picture. Living in a small, isolated village is a major vulnerability factor. Inflation tends to disproportionately affect rural households and thus to amplify spatial inequalities. In most countries, the purchasing power gap between rural and metropolitan households tends to be larger than that between low and high-income households and this gap is driven by energy (figure 5, panel B). Age is another factor of vulnerability to energy and food price inflation, as indicated by the finding of larger purchasing power losses for senior relative to prime-aged households in all countries except Denmark and Spain (figure 5, panel C). But age-related gaps are generally lower than place of living- and income-related gaps.
Figure 5Differences in purchasing power effects between various types of households (pp) DISPLAY Figure
In summary, figure 6 reports the purchasing power loss associated with rising energy prices for the three vulnerable groups covered in the analysis, i.e., low-income, rural and senior households. Main insights are: - Low-income, rural and senior households are more exposed to rising energy prices than the average household but the variation in purchasing power losses across these three vulnerable groups is highly heterogeneous across countries.
- In most countries, rural households are more vulnerable than low-income households to energy price inflation, in particular in the Czech Republic, Spain, and France. This could in part be due to the relatively limited access to public transport and the need to drive higher mileages, but also to differences in energy efficiency of the primary dwellings. Disentangling such drivers is however beyond the scope of the current exercise, and would require access to data at a more granular level.
- Senior households tend to experience milder purchasing power losses than low-income and rural households, in particular in Italy and in the United States.
Figure 6Purchasing power losses from energy price increases: low-income, rural, senior households (%) DISPLAY Figure
4 Granular analysis of non-energy-non-food price inflation
The evidence in the baseline analysis is that inflation is regressive because energy and food price inflation is strongly regressive, while non-energy non-food price inflation tends to be progressive, thus somewhat mitigating (but not offsetting) the effect of rising energy and food prices. Such evidence is obtained by computing the average change in prices on food, energy, and “non-food non-energy” items, each weighted by the respective share on household expenditures. Given the importance of non-energy non-food purchasing power effects, an important question is what drives them.
A granular analysis, giving illustrative insights, is possible for France, Germany, Italy and the United Kingdom, because of the collection of more granular data. 13 Detailed HBS and CPI data are combined to compute the compensating variation (CV) for each of the COICOP-99 one-digit expenditure categories, net of food (COICOP-99 category 1) and energy (COICOP-9 categories 4.5 and 7.2.2) expenditures. The sum of the resulting CVs is equal to the average of the change in prices of each one-digit category, weighted by the respective expenditure shares (exact formulas in the annex). The sum corresponds to the CV of the category “Other” in figure 4, up to a small approximation margin. Performing this exercise for each income bracket sheds light on the distributional effects of changes in major non-food non-energy price items. The results are presented in figure 7 and summarised below.
Average household effects (figure 7, panel A) - Rising prices of recreation and restaurants and of non-energy categories of transport goods and services (e.g., buying a car or an airline ticket) are major drivers of purchasing power losses for the average household across the sample of countries considered.
- Rising prices of non-energy housing (i.e., mostly actual and, in some countries, imputed rentals) have a significant effect in Germany and, to a lesser extent, the United Kingdom. Rising prices of housing furniture add to purchasing power losses for the average household.
Distributional effects (figure 7, panel B) - The effect of rising prices of recreation, restaurants, furnishing and nonenergy transport is progressive, i.e., the price increase affects higher income households more than lower income ones.
- The progressivity of non-energy transport price inflation is particularly marked for Germany. This reflects the significantly large share of expenditures on non-energy transport, especially on the purchase of vehicles, among German high-income households (over three times that of low-income households).
- Non-energy housing price inflation is regressive i.e., affecting low more than high-income households, but the purchasing power difference between high-and low-income households is minor relative to all other spending categories; and furnishing also has a progressive effect.14
Figure 7Non-energy non-food price inflation tends to affect high- more than low-income households DISPLAY Figure
One key implication of this analysis is the potential importance of improving the consistency, granularity, and timeliness of the data, as a basis for research and all the more for policymaking. Reliable timely information on consumption patterns would allow to quantify the reactions of demand to price shifts and expectations. At the moment, detailed data by consumption category is published with a lag. For example, at the time of the analysis, in 2022, the latest harmonized HBS data released by Eurostat was for 2015.
5 Policy discussion
As outlined above, a quantification of the impact on household purchasing power of the price and income based support measures adopted by governments is beyond the scope of this paper. Nonetheless, the results showcase the stark heterogeneity in the exposure of different categories of households to food and energy price shocks. Such heterogeneity in turn suggests the use of targeted support measures. Well-designed income support can limit the burden on government budgets as they preserve price signals for energy savings while providing a financial lifeline to those who need it the most and, in the longer run, improve resilience to price swings while also facilitating a just transition towards a greener economy (OECD, 2022). With respect to effective targeting, our results underscore the need to consider further factors of vulnerability beyond income, notwithstanding the likely correlation among the different factors. One important dimension in this respect may be the area of residence and in particular whether it is rural, as shown in this paper. Yet targeting households living in rural areas is also likely to be crude, as e.g., affluent retirees in the countryside are less vulnerable to rising energy prices than younger people looking for a job in rural areas. Furthermore, other dimensions of vulnerability that could not be covered in the current analysis would also need to be considered, such as housing quality (e.g., energy efficiency) and access to infrastructure (e.g., public transport). The implication is that effective targeting may be logistically and politically complicated and require detailed and timely data on consumption patterns.
Annex
INFORMATION ON DATA SOURCES The two main data sources used in the analysis are the national Household Budget Surveys (HBS) and the Consumer Price Indexes (CPI) databases. While the CPI’s are typically computed on the basis of HBS data, often combined with National Accounts data, important differences exist in the underlying concepts, the methodology, and the statistical coverage of HBS and CPI. For example, for most countries, the CPI does not include owner occupied housing costs (i.e. imputed rents), while those can be included in HBS.
Tables A1 and A2 provide further details on the sources and methodology of CPI and HBS data.
Table A1CPI data DISPLAY Table Table A2 shows that for most countries the categories of expenditures used for HBS data follow the COICOP-98 classification (United Nations Department of Economic and Social Affairs 2000). Japan and the USA represent an exception, as they use their own classifications. The energy component of transportation costs is “Fuels and lubricants for personal transport equipment” (COICOP1998 07.2.2) but needs to be proxied with “Operating of personal transport equipment of private transports” (COICOP1998 07.2) for Denmark, Spain, and Mexico.
Table A2HBS data DISPLAY Table ANALYTICAL APPROACH FOR ASSESSING THE IMPACT OF PRICE CHANGES ON CONSUMERS When assessing the impact of price shocks on consumers, the literature essentially relies on one of two alternative approaches. The first approach is to compute a CPI index of inflation for each household, where a household’s expenditure shares are used as CPI weights (INSEE, 2022b; McGranahan and Paulson, 2006; Jaravel, 2019). The second approach, favoured in the present analysis because it is theoretically founded and interpretable from a welfare perspective, relies on the compensated variation (CV) framework:
where Ci refers to the total expenditure of the household i; pk and qk refer to the price and quantity of the consumption item k, respectively;  refers to the percentage variation in prices of the item k; and sck refers to the expenditures spent on category k as a share of the total expenditure. The CV framework was developed by Deaton (1989) to measure the impact of price changes on consumers’ welfare. This approach has been widely used in the literature: recently by the IMF to assess the effect of surging energy prices on European households’ cost-of-living (Ari et al., 2022) and similarly but on smaller scale by Bruegel (Claeys and Guetta-Jeanrenaud, 2022); by the OECD to assess the effect of trade policy-driven price changes on consumers’ purchasing power (Luu et al., 2020). refers to the percentage variation in prices of the item k; and sck refers to the expenditures spent on category k as a share of the total expenditure. The CV framework was developed by Deaton (1989) to measure the impact of price changes on consumers’ welfare. This approach has been widely used in the literature: recently by the IMF to assess the effect of surging energy prices on European households’ cost-of-living (Ari et al., 2022) and similarly but on smaller scale by Bruegel (Claeys and Guetta-Jeanrenaud, 2022); by the OECD to assess the effect of trade policy-driven price changes on consumers’ purchasing power (Luu et al., 2020).
The main analysis in the paper is based on three consumption categories: food, energy, and other (all goods and services excluding food and energy) and applied to all households and to various household groups, defined and aggregated based on relevant socioeconomic characteristics such as income. The total CV for household group i is hence computed as:
where sck indicates the share of expenditures spent by household group i on category k, and  ![]() ![]() ![]() ![]() ![]() the percentage variation in prices for this category.
For France, Germany, Italy, and UK, the paper is extended with a granular analysis at the COICOP-1-digit level. This requires one to properly separate the energy components from COICOP categories 4 (Housing, containing category 4.5 “Electricity, gas and other fuels”) and 7 (Transports, containing category 7.2.2 “Fuel and lubricants”). In order to achieve this, the analysis exploits CPI and HBS data at the 3-digit COICOP level and applies the following formula:
where the contributions for non-energy COICOP 4 and COICOP 7 are computed as: and For Italy an additional adjustment is necessary, because imputed rents are included among the expenditure categories in HBS data, but not among price categories in CPI data (see tables 1 and 2). To ensure internal consistency, the expenditure shares of all other categories in Italy are therefore first re-scaled so that their total (excluding imputed rents) sums to 100%. The rescaled shares are then multiplied by the corresponding price index, according to the formulas above. A minor adjustment is required for Germany: the category “Water supply, misc. services rel. to the dwelling” has to be excluded, as it is not recorded in HBS data.
DEFINITION OF SOCIO-ECONOMIC GROUPS Table A3 reports details concerning the country-specific definitions of the income brackets used for the analysis. Whenever possible, the analysis is carried out at the quintile-of-income level. When such categorization is not available, the analysis is carried out according to the original definition of income groups by the statistical department releasing HBS data.
Table A3Income DISPLAY Table
Table A4 reports the country-specific definitions of areas of residence
Table A4Place of residence DISPLAY Table
Table A5 reports the country-specific definitions of age groups.
SHIFTS IN CONSUMPTION SHARES DURING COVID-19 This section compares 2019 and 2020 consumption shares for 1-digit COICOP categories of high-income and low-income groups by country, for the countries for which data are available to perform this exercise. The definition for highincome and low-income categories can be found in table A3.
Table A6Czech Republic, income (%) DISPLAY Table Table A7Denmark, income (%) DISPLAY Table Table A8Italy, income (%) DISPLAY Table Table A9Japan, income (%) DISPLAY Table Table A10Mexico, income (%) DISPLAY Table Table A11Spain, income (%) DISPLAY Table Table A12United Kingdom, income (%) DISPLAY Table Table A13United States, income (%) DISPLAY Table
ADDITIONAL COUNTRY-BY-COUNTRY DESCRIPTIVE MATERIAL AND RESULTS This section contains additional country-by-country results on the expenditure shares and the inflation-driven purchasing power losses across income groups, where the definition of income categories can be found in table A3. 15 Specifically, five expenditure categories are considered in figure A1: Energy, Food, Transport, Housing, Recreation and Accommodation, and Other. In figure A2, showing the changes in purchasing power across income groups, the categories considered are: Food, Energy, Other (non-food, non-energy) and Total.
Figure A1Country-by-country expenditure shares across income groups (%) DISPLAY Figure Figure A2Country-by-country purchasing power losses across income groups (%) DISPLAY Figure
Notes
* The views expressed in this paper are those of the authors and do not necessarily reflect those of the OECD and its member countries. The authors gratefully acknowledge the support and fruitful comments received from Douglas Sutherland, Assia Elgouacem, Luiz de Mello, Alain de Serres, Lucasz Rawdanowicz, Antoine Goujard, Michael Kölle, Tim Bulman, Hélène Blake, and Pierre-Alain Pionnier as well as to two anonymous reviewers. They also express the deepest appreciation to Michael Abendschein for his contributions in the early stages of the project.
1 Households across the income distribution experience differential inflation effects for several reasons: consumption shares may differ systematically (e.g. for low- and high-income households); the goods and services within each consumption category may differ; the ability to substitute lower-priced alternatives of the same item may differ; and prices paid for the same good may differ systematically due to differences in access. Experimental measures of consumer prices for different household groups have been recently constructed for several countries. See Klick and Stockburger (2021) and Orchard (2022) for recent experimental evidence in the case of the United States.
2 The Annex provides details on countries’ data sources.
3 As a result, the purchasing power loss from “all items” inflation for the average household does not necessarily match the official CPI from OECD.stat. The numbers can be reconciled by factoring out methodological differences, for instance applying the CPI weights from OECD.stat instead of the HBS weights for the average household (this technical material is available upon request).
4 The current exercise is based on changes in CPI between August 2021 and August 2022 except otherwise stated.
5 See above and OECD (2023a) for details on CPI methodology.
6 One possible concern is that the COVID-19 crisis induced changes in consumption patterns by lockdowns and restrictions. This poses analytical challenges because the 2020 weights differ from the pre-COVID weights and may differ from the post-COVID weights. The problem raised by spending shifts during the pandemic has been addressed by the OECD Statistic Directorate, by various National Statistical offices and researchers, using different experimental methods. Almost all these studies find small effects on 2020 inflation. As a robustness check on this issue, the annex reports a comparison between 2019 and 2020 expenditure weights across income groups for countries that collect yearly HBS data. This exercise shows that while 2020 weights tend to differ from 2019 weights in some consumption categories, the difference in such weights between income groups is stable over the period.
7 The annex reports more detailed expenditure shares for all countries covered by the study.
8 These various vulnerability dimensions are to some extent correlated, e.g., high-income prime-aged households living in metropolitan areas; but, as also suggested by the illustrative charts in this section, such correlation is not necessarily very high and, in any case, differs across countries.
9 See INSEE (2022a) for a recent assessment of the role of differences in the spending structure of the average household in explaining differences in HIPC inflation between France and three other big Euro area countries (i.e., Germany, Italy, and Spain).
10 Due to the differences in formulas between CPI and CV discussed above, these numbers are close but not identical to official average inflation figures.
11 See Blake and Bulman (2022) for the technical background paper associated with the Survey of Greece.
12 These distributional effects can be nuanced to the extent that they may differ by energy carrier, see Flues and Thomas (2015).
13 Major methodological and data-driven obstacles, which are even more constraining in a cross-country perspective, precluded an examination of these, in particular, cross-country differences in consumer items classification: while most countries rely on the COICOP-99 classification (UN, 2000), Japan and the United States adopt a different classification, raising complex mapping issues. In addition, cross-country and within-country differences in the treatment of housing expenditure and prices: some countries cover only actual rentals in HBS data (e.g. France), while others cover both actual and imputed rentals (e.g. Germany). In addition, a few countries include imputed rentals in HBS but not in CPI data. This is the case for Italy and the United Kingdom.
14 Such housing effects should be interpreted with caution, owing to cross-country differences in the coverage and measurement of owner-occupied housing costs (imputed rentals), as already mentioned. For instance, among the countries covered, Germany is the only country for which the data and thus the analysis include imputed rentals.
15 Detailed materials and results by area of residence and age groups are available upon request.
* The views expressed in this paper are those of the authors and do not necessarily reflect those of the OECD and its member countries. The authors gratefully acknowledge the support and fruitful comments received from Douglas Sutherland, Assia Elgouacem, Luiz de Mello, Alain de Serres, Lucasz Rawdanowicz, Antoine Goujard, Michael Kölle, Tim Bulman, Hélène Blake, and Pierre-Alain Pionnier as well as to two anonymous reviewers. They also express the deepest appreciation to Michael Abendschein for his contributions in the early stages of the project.
1 Households across the income distribution experience differential inflation effects for several reasons: consumption shares may differ systematically (e.g. for low- and high-income households); the goods and services within each consumption category may differ; the ability to substitute lower-priced alternatives of the same item may differ; and prices paid for the same good may differ systematically due to differences in access. Experimental measures of consumer prices for different household groups have been recently constructed for several countries. See Klick and Stockburger ( 2021) and Orchard ( 2022) for recent experimental evidence in the case of the United States.
2 The Annex provides details on countries’ data sources.
3 As a result, the purchasing power loss from “all items” inflation for the average household does not necessarily match the official CPI from OECD.stat. The numbers can be reconciled by factoring out methodological differences, for instance applying the CPI weights from OECD.stat instead of the HBS weights for the average household (this technical material is available upon request).
4 The current exercise is based on changes in CPI between August 2021 and August 2022 except otherwise stated.
5 See above and OECD ( 2023a) for details on CPI methodology.
6 One possible concern is that the COVID-19 crisis induced changes in consumption patterns by lockdowns and restrictions. This poses analytical challenges because the 2020 weights differ from the pre-COVID weights and may differ from the post-COVID weights. The problem raised by spending shifts during the pandemic has been addressed by the OECD Statistic Directorate, by various National Statistical offices and researchers, using different experimental methods. Almost all these studies find small effects on 2020 inflation. As a robustness check on this issue, the annex reports a comparison between 2019 and 2020 expenditure weights across income groups for countries that collect yearly HBS data. This exercise shows that while 2020 weights tend to differ from 2019 weights in some consumption categories, the difference in such weights between income groups is stable over the period.
7 The annex reports more detailed expenditure shares for all countries covered by the study.
8 These various vulnerability dimensions are to some extent correlated, e.g., high-income prime-aged households living in metropolitan areas; but, as also suggested by the illustrative charts in this section, such correlation is not necessarily very high and, in any case, differs across countries.
9 See INSEE ( 2022a) for a recent assessment of the role of differences in the spending structure of the average household in explaining differences in HIPC inflation between France and three other big Euro area countries (i.e., Germany, Italy, and Spain).
10 Due to the differences in formulas between CPI and CV discussed above, these numbers are close but not identical to official average inflation figures.
11 See Blake and Bulman ( 2022) for the technical background paper associated with the Survey of Greece.
12 These distributional effects can be nuanced to the extent that they may differ by energy carrier, see Flues and Thomas ( 2015).
13 Major methodological and data-driven obstacles, which are even more constraining in a cross-country perspective, precluded an examination of these, in particular, cross-country differences in consumer items classification: while most countries rely on the COICOP-99 classification (UN, 2000), Japan and the United States adopt a different classification, raising complex mapping issues. In addition, cross-country and within-country differences in the treatment of housing expenditure and prices: some countries cover only actual rentals in HBS data (e.g. France), while others cover both actual and imputed rentals (e.g. Germany). In addition, a few countries include imputed rentals in HBS but not in CPI data. This is the case for Italy and the United Kingdom.
14 Such housing effects should be interpreted with caution, owing to cross-country differences in the coverage and measurement of owner-occupied housing costs (imputed rentals), as already mentioned. For instance, among the countries covered, Germany is the only country for which the data and thus the analysis include imputed rentals.
15 Detailed materials and results by area of residence and age groups are available upon request.
Disclosure statement
The authors have no potential conflict of interest to report.
References
Ari, A. [et al.], 2022. Surging Energy Prices in Europe in the Aftermath of the War: How to Support the Vulnerable and Speed up the Transition Away from Fossil Fuels. IMF Working Paper, No. 152 [ CrossRef]
Blake, H. and Bulman, T., 2022. Surging energy prices are hitting everyone but which households are-more-exposed? Ecoscope, May 10, 2022.
Deaton, A., 1989. Rice prices and income distribution in Thailand: a non-parametric analysis. The Economic Journal, 99(395), pp. 1-37 [ CrossRef]
Flues, F. and Thomas, A., 2015. The distributional effects of energy taxes. OECD Taxation Working Papers, No. 23 [ CrossRef]
IEA, 2021. World Energy Outlook 2021. Paris: International Energy Agency [ CrossRef]
INSEE, 2022a. Dans les principales économies de la zone euro, l’énergie reste le premier facteur d’infl ation, mais avec des diff érences entre les pays. Note de conjuncture, 24. 6. 2022.
INSEE, 2022b. Guerre et Prix. Paris: L'Institut national de la statistique et des études économiques.
Jaravel, X., 2019. The unequal gains from product innovations: evidence from the US retail sector. The Quarterly Journal of Economics, 134(2), pp. 715-783 [ CrossRef]
Klick, J. and Stockburger, A., 2021. Experimental CPI for lower and higher income households. BLS working paper, No 537.
Luu, N. [et al.], 2020. Mapping trade to household budget survey: A conversion framework for assessing the distributional impact of trade policies. Paris: OECD. [ CrossRef]
Madec, P., Plane, M. and Sampognaro, R., 2022. Une analyse macro et microéconomique di puvoir d'achat. Etude OFCE, No. 2.
OECD/KIPF, 2014. The Distributional Effects of Consumption Taxes in OECD Countries. Paris: OECD [ CrossRef]
Orchard, J., 2022. Cyclical Demand Shifts and Cost of Living Inequality [ CrossRef]
Porto, G., 2006. Using survey data to assess the distributional effects of trade policy. Journal of International Economics, 70(1), pp. 140-160 [ CrossRef]
|
|
|
December, 2023
IV/2023
|


