4886
Views
1097
Downloads |
Distribution of household assets in Croatia
Marina Kunovac* 
Article | Year: 2020 | Pages: 265 - 297 | Volume: 44 | Issue: 3 Received: October 21, 2019 | Accepted: February 24, 2020 | Published online: September 1, 2020
|

FULL ARTICLE
FIGURES & DATA
REFERENCES
CROSSMARK POLICY
METRICS
LICENCING
PDF
|
|
Gross sample
|
Net sample
|
Population
|
|
Strata
|
Number of
randomly selected occupied dwellings in the strata*
|
% share
|
Number of
respondent households in HFCS
|
% share
|
Number of
occupied dwellings in population
|
% share
|
|
Central Croatia, city, HMR < 120 square meters
|
220
|
6
|
74
|
5
|
124,958
|
8
|
|
Central Croatia, municipality, HMR < 120 square meters
|
150
|
4
|
59
|
4
|
96,573
|
6
|
|
City of Zagreb, HMR < 120 square meters
|
830
|
21
|
133
|
10
|
279,420
|
19
|
|
Eastern Croatia, city, HMR < 120 square meters
|
485
|
12
|
229
|
17
|
230,580
|
15
|
|
Eastern Croatia, municipality, HMR < 120 square meters
|
225
|
6
|
128
|
9
|
140,397
|
9
|
|
Adriatic Coast, city, HMR < 120 square meters
|
480
|
12
|
158
|
12
|
232,817
|
16
|
|
Adriatic Coast, municipality, HMR < 120 square meters
|
230
|
6
|
64
|
5
|
128,137
|
9
|
|
Cities of Split and Rijeka, HMR < 120 square meters
|
380
|
10
|
103
|
8
|
111,113
|
7
|
|
Central Croatia, city, HMR >
120 square meters
|
155
|
4
|
63
|
5
|
26,420
|
2
|
|
Central Croatia, municipality, HMR > 120 square meters
|
100
|
3
|
52
|
4
|
19,602
|
1
|
|
City of Zagreb, HMR > 120
square meters
|
195
|
5
|
60
|
4
|
20,557
|
1
|
|
Eastern Croatia, city, HMR >
120 square meters
|
225
|
6
|
125
|
9
|
33,039
|
2
|
|
Eastern Croatia, municipality, HMR
> 120 square meters
|
95
|
2
|
50
|
4
|
18,635
|
1
|
|
Adriatic Coast, city, HMR >120
square meters
|
115
|
3
|
28
|
2
|
17,641
|
1
|
|
Adriatic Coast, municipality, HMR
> 120 square meters
|
85
|
2
|
21
|
2
|
14,064
|
1
|
|
Cities of Split and Rijeka, HMR
> 120 square meters
|
30
|
1
|
10
|
1
|
2,605
|
0,2
|
|
TOTAL
|
4000
|
100
|
1357
|
100
|
1,496,558
|
100
|
Note: Geographical location “Adriatic Coast” includes the following counties: Primorje-Gorski Kotar, Lika-Senj, Zadar, Šibenik-Knin, Split-Dalmatia, Istria and Dubrovnik-Neretva. Geographical location “Eastern Croatia” includes the following counties: Sisak-Moslavina, Karlovac, Bjelovar-Bilogora, Virovitica-Podravina, Požega-Slavonia, Brod-Posavina, Osijek-Baranja and Vukovar-Srijem. Geographical location “Central Croatia” includes the following counties: Zagreb, Krapina-Zagorje, Varaždin, Koprivnica-Križevci and Međimurje. Source: ECB and author’s calculations.
|
Components of net assets
|
Share of households, in %
|
Median, in EUR thousands
|
Mean, in EUR thousands
|
Share in total value of
assets/liabilities
|
|
|
|
(1) Real assets
|
94
|
70
|
114
|
97
|
|
|
Main residence (85%)
|
85
|
66
|
94
|
73
|
|
|
Other real estate
|
23
|
20
|
54
|
11
|
|
|
Vehicles
|
69
|
4
|
6
|
4
|
|
|
Other valuables
|
4
|
2
|
6
|
0
|
|
|
Self-employment business assets*
|
5
|
25
|
209
|
9
|
|
|
(2) Financial assets
|
82
|
0.5
|
5
|
3
|
|
|
Sight accounts
|
80
|
0.2
|
9
|
1
|
|
|
Savings accounts
|
14
|
5
|
13
|
2
|
|
|
Voluntary pension funds/ whole life insurance
|
6
|
5
|
6
|
0
|
|
|
Mutual funds
|
1.4
|
3
|
4
|
0
|
|
|
Money owed to household
|
3
|
2
|
6
|
0
|
|
|
Shares
|
5
|
2
|
4
|
0
|
|
|
Bonds
|
0.4
|
0.1
|
69
|
0
|
|
|
Other types of financial assets
|
0.7
|
0
|
0.2
|
0
|
|
|
(3) Liabilities
|
41
|
2
|
10
|
-
|
|
|
Mortgage debt
|
9
|
20
|
30
|
66
|
|
|
for main residence
|
9
|
20
|
30
|
63
|
|
|
for other real estate
|
0.4
|
16
|
26
|
3
|
|
|
Non-mortgage debt
|
36
|
2
|
4
|
34
|
|
|
Credit lines/overdrafts
|
27
|
1
|
1
|
9
|
|
|
Credit card debt
|
6
|
0.4
|
0.8
|
1
|
|
|
Other non-mortgage loans
|
13
|
5
|
8
|
24
|
|
|
(1+2) Gross assets
|
98
|
67
|
111
|
-
|
|
|
((1+2)-3) Net assets
|
100
|
61
|
107
|
-
|
|
Note: *Self-employment business assets means any household-owned component of real assets (real estates, vehicles or valuables) used in running a self-employment business. Gross assets are calculated as the sum of real and financial assets. Net assets equal the amount of gross assets net of household liabilities. Since the survey has been harmonised across EU member states, its values are expressed in euros. Median and means are calculated for the households that own a certain category of assets. Source: ECB and author’s calculations.
Source: ECB and author’s calculations.
Source: ECB and author's calculations.
Source: ECB and author’s calculations.
Source: ECB and author’s calculations.
 Source: ECB and author’s calculations.
Source: ECB and author’s calculations.
Note: Geographical location “Adriatic Coast” includes the following counties: Primorje-Gorski Kotar, Lika-Senj, Zadar, Šibenik-Knin, Split-Dalmatia, Istria and Dubrovnik-Neretva. Geographical location “Eastern Croatia” includes the following counties: Sisak-Moslavina, Karlovac, Bjelovar-Bilogora, Virovitica-Podravina, Požega-Slavonia, Brod-Posavina, Osijek-Baranja and Vukovar-Srijem. Geographical location “Central Croatia” includes the following counties: Zagreb, Krapina-Zagorje, Varaždin, Koprivnica-Križevci and Međimurje. Source: ECB and author’s calculations.
Note![]() : Geographical location “Adriatic Coast” includes the following counties: Primorje-Gorski Kotar, Lika-Senj, Zadar, Šibenik-Knin, Split-Dalmatia, Istria and Dubrovnik-Neretva. Geographical location “Eastern Croatia” includes the following counties: Sisak-Moslavina, Karlovac, Bjelovar-Bilogora, Virovitica-Podravina, Požega-Slavonia, Brod-Posavina, Osijek-Baranja and Vukovar-Srijem. Geographical location “Central Croatia” includes the following counties: Zagreb, Krapina-Zagorje, Varaždin, Koprivnica-Križevci and Međimurje. : Geographical location “Adriatic Coast” includes the following counties: Primorje-Gorski Kotar, Lika-Senj, Zadar, Šibenik-Knin, Split-Dalmatia, Istria and Dubrovnik-Neretva. Geographical location “Eastern Croatia” includes the following counties: Sisak-Moslavina, Karlovac, Bjelovar-Bilogora, Virovitica-Podravina, Požega-Slavonia, Brod-Posavina, Osijek-Baranja and Vukovar-Srijem. Geographical location “Central Croatia” includes the following counties: Zagreb, Krapina-Zagorje, Varaždin, Koprivnica-Križevci and Međimurje. Source: ECB and author’s calculations.
|
|
|
Net asset quntiles
|
|
|
|
1
|
2
|
3
|
4
|
5
|
|
Income per quintiles
|
1
|
0.14***
|
0.14***
|
-0.04
|
-0.05
|
-0.20***
|
|
2
|
0.16***
|
0.13***
|
0.05
|
-0.06
|
-0.28***
|
|
3
|
0.10***
|
0.11***
|
0.01
|
0.00
|
-0.22***
|
|
4
|
0.11***
|
0.05
|
-0.05
|
-0.03
|
-0.08**
|
|
HMR Characteristics
(inheritance and location)
|
Inheritance_HMR
|
-0.11***
|
0.07***
|
0.05*
|
0.01
|
-0.02
|
|
HMR_City of Zagreb
|
0.00
|
-0.21***
|
-0.05
|
0.07*
|
0.19***
|
|
HMR_Primorje
|
0.02
|
-0.24***
|
-0.06**
|
0.09***
|
0.18***
|
|
HMR_Central Croatia
|
0.00
|
-0.03
|
-0.08***
|
0.03
|
0.08***
|
|
Socio-demographic
characteristics of reference person
|
Sex (male)
|
-0.02
|
0.04*
|
-0.03
|
-0.02
|
0.02
|
|
Retirement
|
-0.01
|
-0.09**
|
0.02
|
0.00
|
0.09***
|
|
Unemployed/non-active
|
0.05
|
0.02
|
-0.06
|
-0.01
|
0.00
|
|
Self-employed
|
-0.24***
|
0.06
|
-0.14
|
0.08
|
0.24***
|
|
Secondary education
|
-0.14***
|
-0.06
|
0.03
|
0.06
|
0.12*
|
|
Higher education
|
-0.19***
|
0.13**
|
0.05
|
0.08
|
0.20***
|
|
35-45 age group
|
-0.13***
|
-0.01
|
0.04
|
0.05
|
0.05
|
|
45-64 age group
|
-0.18***
|
0.00
|
0.07
|
0.01
|
0.11**
|
|
65+ age group
|
-0.27***
|
0.07
|
0.04
|
0.05
|
0.12**
|
|
Household characteristics
|
Number of children in household
|
0.05***
|
0.02
|
0.00
|
-0.05***
|
-0.01
|
|
Number of household members
|
-0.03***
|
-0.02*
|
0.00
|
0.03**
|
0.02*
|
|
Indicators of debt burden
|
Mortgage for HMR
|
-0.08**
|
0.11**
|
0.04
|
-0.02
|
-0.05
|
|
Consumer debt
|
0.07***
|
-0.03
|
-0.03
|
0.03
|
-0.03
|
|
Other characteristics
|
Social benefits recipients
|
0.07**
|
0.02
|
-0.05
|
0.04
|
-0.08*
|
|
Willingness to take risks
|
0.01
|
-0.08
|
-0.06
|
0.02
|
0.10**
|
* Generalized ordered probit model, marginal effects Note: Symbols ***, ** and * indicate statistical significance of 99%, 95% and 90% respectively. Reference categories: for income – Income_5quintile group for the HMR location – _HMR location Eastern Croatia; for labour market status – Employed; for educational attainment – Primary education or no education, for age – Up to 34 years of age. Source: ECB and author’s calculations.
|
Information on the reference person
|
HFCS
|
EU SILC
|
|
Education
|
Primary
|
24
|
26
|
|
Secondary
|
59
|
57
|
|
Higher
|
16
|
17
|
|
Age
|
Under 24
|
25
|
26
|
|
25-54
|
37
|
41
|
|
55-64
|
17
|
14
|
|
65+
|
21
|
19
|
|
Labour market status
|
Employed
|
45
|
38
|
|
Self-employed
|
3
|
4
|
|
Retirement
|
42
|
31
|
|
Non-active/unemployed
|
9
|
27
|
|
Average household size (no.of individuals)
|
2.8
|
2.8
|
|
Information on main residence
|
|
|
|
|
Owners
|
85
|
90
|
|
Renters
|
15
|
10
|
Note: Information on the reference person for the HFCS was calculated by using the estimated weights and all five versions of data imputations. Information on the reference persons for the EU-SILC was taken from the Eurostat data. Source: ECB and Eurostat (EU SILC).
|
Components of net assets
|
Gini coefficient
|
|
|
|
Real assets
|
0.59
|
|
|
Main residence
|
0.56
|
|
|
Other real estate
|
0.93
|
|
|
Vehicles
|
0.69
|
|
|
Other valuables
|
0.99
|
|
|
Self-employment business assets
|
0.99
|
|
|
Financial assets
|
0.88
|
|
|
Current accounts
|
0.83
|
|
|
Savings accounts
|
0.96
|
|
|
Voluntary pension/life insurance
|
0.99
|
|
|
Mutual funds
|
0.99
|
|
|
Money owed to household
|
0.99
|
|
|
Shares
|
0.98
|
|
|
Bonds
|
0.99
|
|
|
Other types of financial assets
|
0.96
|
|
|
Liabilities
|
0.90
|
|
|
Mortgage debt
|
0.96
|
|
|
Non-mortgage debt
|
0.89
|
|
|
Total annual gross income
|
0.51
|
|
|
Gross assets
|
0.59
|
|
|
Net assets
|
0.61
|
|
Source: ECB and author’s calculations.
|
|
|
Net asset quintiles
|
|
|
|
1
|
2
|
3
|
4
|
5
|
|
Income per quintiles
(OECD)
|
1
|
0.13***
|
0.13***
|
-0.01
|
-0.06
|
-0.18***
|
|
2
|
0.16***
|
0.12***
|
0.01
|
-0.07*
|
-0.22***
|
|
3
|
0.10***
|
0.10**
|
0.03
|
-0.05
|
-0.18***
|
|
4
|
0.06
|
0.05
|
0.03
|
-0.05
|
-0.10***
|
|
HMR Characteristics
(inheritance and location)
|
Inheritance_HMR
|
-0.11***
|
0.08***
|
0.04*
|
0.01
|
-0.02
|
|
HMR_City of Zagreb
|
0.00
|
-0.22***
|
-0.04
|
0,06*
|
0.21***
|
|
HMR_Primorje
|
0.03
|
-0.24***
|
-0.07***
|
0.09***
|
0.18***
|
|
HMR_Central Croatia
|
0.00
|
-0.03
|
-0.08**
|
0.02
|
0.08***
|
|
Socio-demographic
characteristics of reference person
|
Sex (male)
|
-0.01
|
0.04*
|
-0.03
|
-0.02
|
0.02
|
|
Retirement
|
-0.02
|
-0.08*
|
0.02
|
0.01
|
0.08**
|
|
Unemployed/non-active
|
0.04
|
0.03
|
-0.05
|
-0.01
|
-0.01
|
|
Self-employed
|
-0.26***
|
0.06
|
-0.11
|
0.08
|
0.23***
|
|
Secondary education
|
-0.14***
|
-0.06
|
0.03
|
0.06
|
0.10
|
|
Higher education
|
-0.17***
|
-0.11**
|
0.03
|
0.07
|
0.18***
|
|
35-45 age group
|
-0.13***
|
-0.02
|
0.04
|
0.05
|
0.06
|
|
45-64 age group
|
-0.18***
|
-0.01
|
0.06
|
0.01
|
0.12**
|
|
65+ age group
|
-0.27***
|
0.06
|
0.04
|
0.05
|
0.13**
|
|
Household characteristics
|
Number of children in household
|
0.05***
|
0.03
|
-0.01
|
-0.05***
|
-0.02
|
|
Number of household members
|
-0.04***
|
-0.03***
|
0.00
|
0.03***
|
0.05***
|
|
Indicators of debt burden
|
Mortgage for HMR
|
-0.08*
|
0.10**
|
0.05
|
-0.03
|
-0.06
|
|
Consumer debt
|
0.07***
|
-0.02
|
-0.04*
|
0.03
|
-0.03
|
|
Other characteristics
|
Social benefits recipients
|
0.07**
|
0.02
|
-0.05
|
0.03
|
-0.07*
|
|
Willingness to take risks
|
0.02
|
-0.07
|
-0.05
|
0.01
|
0.09*
|
Note: Symbols ***, ** and * indicate statistical significance of 99%, 95% and 90% respectively. Reference categories: for income – Income_5quntile group for the HMR location – _HMR location Eastern Croatia; for labour market status – Employed; for educational attainment – Primary education or no education, for age – Up to 34 years of age. Source: ECB and author’s calculations.
|
|
|
Net asset quintiles
|
|
|
|
1
|
2
|
3
|
4
|
5
|
|
Income per quintiles >
EUR 1,300
|
1
|
0.28***
|
0.07
|
-0.01
|
-0.08
|
-0.26***
|
|
2
|
0.18***
|
0.06
|
-0.03
|
-0.03
|
-0.25***
|
|
3
|
0.14***
|
0.09**
|
-0.01
|
-0.04
|
-0.18***
|
|
4
|
0.13***
|
0.02
|
-0.05
|
-0.02
|
-0.09*
|
|
HMR Characteristics
(inheritance and location)
|
Inheritance_HMR
|
-0.15***
|
0.12***
|
0.04
|
0.00
|
-0.02
|
|
HMR_City of Zagreb
|
0.05
|
-0.25***
|
-0.06
|
0.06*
|
0.20***
|
|
HMR_Primorje
|
0.04
|
-0.27***
|
-0.06*
|
0.11***
|
0.18***
|
|
HMR_Central Croatia
|
0.00
|
-0.04
|
-0.08**
|
0.06*
|
0.06**
|
|
Socio-demographic
characteristics of reference person
|
Sex (male)
|
-0.01
|
0.04
|
-0.03
|
-0.03
|
0.02
|
|
Retirement
|
-0.02
|
-0.03
|
-0.01
|
-0.01
|
0.08**
|
|
Unemployed/non-active
|
0.01
|
0.02
|
-0.01
|
0.00
|
-0.01
|
|
Self-employed
|
-0.97
|
0.79
|
-0.11
|
0.04
|
0.25***
|
|
Secondary education
|
-0.13***
|
-0.08
|
0.05
|
0.01
|
0.15
|
|
Higher education
|
-0.12**
|
-0.20***
|
0.08
|
0.02
|
0.22*
|
|
35-45 age group
|
-0.16***
|
0.06
|
0.00
|
0.04
|
0.06
|
|
45-64 age group
|
-0.20***
|
0.02
|
0.04
|
0.03
|
0.12**
|
|
65+ age group
|
-0.32***
|
0.11*
|
0.03
|
0.05
|
0.13**
|
|
Household characteristics
|
Number of children in household
|
0.04**
|
0.04*
|
-0.01
|
-0.05**
|
-0.02
|
|
Number of household members
|
-0.02
|
-0.04**
|
0.00
|
0.03**
|
0.02*
|
|
Indicators of debt burden
|
Mortgage for HMR
|
-0.07*
|
0.14***
|
0.03
|
-0.04
|
-0.06
|
|
Consumer debt
|
0.08***
|
-0.04
|
-0.03
|
0.02
|
-0.03
|
|
Other characteristics
|
Social benefits recipients
|
0.07**
|
0.03
|
-0.08*
|
0.05
|
-0.07
|
|
Willingness to take risks
|
-0.04
|
-0.07
|
-0.03
|
0.06
|
0.08
|
* Generalized ordered probit model, marginal effects, sample excludes the households that reported annual gross income lower than EUR 1,300 and the accompanying income and net asset quintiles modified accordingly Note: Symbols ***, ** and * indicate statistical significance of 99%, 95% and 90% respectively. Reference categories: for income – Income_5quntile group for the HMR location – _HMR location Eastern Croatia; for labour market status – Employed; for educational attainment – Primary education or no education, for age – Up to 34 years of age. Source: ECB and author’s calculations.
|
|
|
OLS
(Model 1)
|
OLS
(Model 2)
|
Ordered probit model
(Model 3)
|
|
Income per quintiles
(OECD)
|
1
|
-0.78***
|
|
-0.71***
|
|
2
|
-1.16***
|
|
-0.88***
|
|
3
|
-0.69***
|
|
-0.64***
|
|
4
|
-0.41**
|
|
-0.39***
|
|
|
log (annual gross income)
|
|
-0.39***
|
|
|
|
log (annual gross income)^2
|
|
0.04***
|
|
|
HMR Characteristics
(inheritance and location)
|
Inheritance_HMR
|
0.55***
|
0.55***
|
0.15**
|
|
HMR_City of Zagreb
|
0.50**
|
0.54***
|
0.61***
|
|
HMR_Primorje
|
0.38**
|
0.40**
|
0.53***
|
|
HMR_Central Croatia
|
0.23
|
0.24
|
0.15*
|
|
Socio-demographic
characteristics of reference person
|
Sex (male)
|
0.06
|
0.07
|
0.03
|
|
Retirement
|
0.48**
|
0.23
|
0.29***
|
|
Unemployed/non-active
|
-0.45**
|
-0.42*
|
-0.12
|
|
Self-employed
|
1.03***
|
1.02***
|
0.97***
|
|
Secondary education
|
0.59**
|
0.77***
|
0.50***
|
|
Higher education
|
0.81**
|
1.03***
|
0.75***
|
|
35-45 age group
|
0.75***
|
|
0.48***
|
|
45-64 age group
|
0.97***
|
|
0.69***
|
|
65+ age group
|
1.06***
|
|
0.81***
|
|
|
log (age)
|
|
1.21***
|
|
|
Household characteristics
|
Number of children in household
|
-0.27**
|
-0.25**
|
-0.18***
|
|
Number of household members
|
0.33***
|
0.26***
|
0.22***
|
|
Indicators of debt burden
|
Mortgage for HMR
|
0.24
|
0.24
|
0.02
|
|
Consumer debt
|
0.15
|
0.18
|
-0.17**
|
|
Other characteristics
|
Social benefits recipients
|
-0.57**
|
-0.52**
|
-0.23**
|
|
Willingness to take risks
|
0.37
|
0.54*
|
0.16
|
|
|
Constant
|
8.44
|
3.96
|
|
|
Wald thest for homogeneity of coefficients
|
chi2
|
|
|
219.84
|
|
Prob>chi2
|
|
|
0.000
|
Note: The Model 2 of the least squares estimator includes the income square due to the non-linear effect of income. The Model 3 is an ordered probit model (homogeneous coefficient for different categories of the dependent variable). The results of the Model 3 show the estimated model coefficients rather than marginal effects. The Table also shows the results of the Wald test that rejects the homogeneity assumption (parallel line assumption test). Source: ECB and author’s calculations.
|
|
|
Abstract
This paper analyses the main components and distribution of household net assets in Croatia on the basis of the data from the Household Finance and Consumption Survey (HFCS) by taking into account different socio-demographic characteris¬tics of households. The main results indicate that real assets are widely distributed among households, whereby 85% of households own the household main resi¬dence. Financial assets and liabilities account for larger share among wealthier households. The analysis of the main determinants establishing the position of an individual household in distribution of assets has additionally highlighted the importance of the household main residence (HMR). Households with inherited HMR are less likely to be positioned in the lowest net asset quintile. In addition, households with HMR in the city of Zagreb or on the Adriatic Coast are more likely to be in higher asset quintile groups. The survey has also found that the level of household income, educational attainment, labour market status and age of the household reference person affect the probability of positioning a household in a certain net asset quintile.
Keywords: survey data; Household Finance and Consumption Survey (HFCS); net household assets; household inequality; intergenerational transfers; Croatia
JEL: D1, D31, C35
1 Introduction
Potential inequality in distribution of different types of assets among households should be considered when designing public policies, such as monetary, macroprudential and other public policies (tax, demographic, social and regional policy). In that sense, monetary policy may have a reallocation effect on households depending on initial distribution of income, assets and liabilities among households and their exposure to the interest rates channel (Auclert,  2017; Tzamourani, 2019). Macroprudential policy contributing to maintaining stability of financial system at the same time may also affect distribution of assets among households (Carpantier, Olivera and Van Kerm, 2017). For these reasons, implementation of monetary policy and design of macroprudential measures to maintain financial stability should be accompanied by the analysis of inequality in distribution of household assets. 2017; Tzamourani, 2019). Macroprudential policy contributing to maintaining stability of financial system at the same time may also affect distribution of assets among households (Carpantier, Olivera and Van Kerm, 2017). For these reasons, implementation of monetary policy and design of macroprudential measures to maintain financial stability should be accompanied by the analysis of inequality in distribution of household assets.
Inequality among households in Croatia has previously been analysed on the basis of income data only (e.g. Nestić, 2005; Rubil, 2013; Rubil, Stubbs and Zrinščak, 2018). The following paper builds upon the existing literature on inequality in distribution of household income and provides an analysis of distribution of household assets in Croatia. The analysis is based on the data collected in the Household Finance and Consumption Survey (HFCS) that the Croatian National Bank (CNB) first carried out on a sample of households in Croatia in mid 2017. The survey covered detailed data on household real and financial assets, liabilities, income, consumption and other socio-demographic characteristics of households. text
This paper brings new insights into distribution of different components of household net assets and the main determinants that establish relative position of an individual household in terms of distribution of net assets. Prior to the survey, the analysis of household assets in Croatia completely depended on aggregate data sources such as financial accounts that contained the data on total financial assets and liabilities, but did not include information on distribution of assets and liabilities and inequality among households. In addition, researchers did not have adequate data source for analysis of household real assets.
Apart from detailed analysis of distribution of household assets, the paper analyses the main determinants establishing the position of a household in the distribution of net assets by using the generalized ordered probit model. To the author’s knowledge, the analysis of determinants affecting the position of a household in the distribution of net assets has not yet been carried out in Croatia. On the other hand, this has been a subject of extensive literature for the euro area counties (e.g. Du Caju, 2103; Sierminska and Medgyesi, 2013; Kontbay-Busun and Peichl, 2015; Leitner, 2015; Fessler and Schürz, 2015; Arrondel, Roger and Savignac, 2014) on the basis of the HFCS data from the two previous survey waves.
The analysis has found inequality in distribution of certain asset categories among Croatian households. Real assets account for a large share of household total assets, much more than in other EU countries, given that 85% of households own the household main residence (HMR). 2 The median value of the main residence amounts to 66 thousand euros and it makes up the bulk of total net household assets. Significant inequality was observed in terms of financial assets because only a certain portion of households own substantial financial assets. The median value of household financial assets stands at 500 euros. The results of descriptive analysis have pointed to variation in distribution of total net household assets, depending on different socio-demographic characteristics, income, real asset ownership and geographic location.
With regard to the determinants establishing the position of a household in the distribution of net assets, results of the generalized ordered probit model indicate a correlation between a household position in distribution of income and assets, but its statistical significance and intensity varies depending on the position of a household in the income distribution. This result is robust for different specifications of household income. The way the HMR was acquired helps to explain the probability of having a certain household in a certain asset quintile in case of lower asset levels, but it is not significant for determining the probability of positioning a household in higher net asset quintiles.
The analysis has also emphasised the importance of geographical location of the HMR, whereby, all other factors being equal, households with the main residence in the City of Zagreb or on the Adriatic Coast are much more likely to be in higher net asset quintiles compared with households with the main residence in Eastern Croatia. In addition, educational attainment, labour market status and age very much affect the probability of positioning a household in a certain net asset quintile. In that respect, households with more educated and older reference persons and households with self-employed reference person are more likely to be wealthier.
The structure of the paper is as follows: the second chapter includes basic information on the technical implementation of the survey and survey design. The third chapter covers detailed information about the main components of net assets: real and financial assets and liabilities, their distribution among households and values. Inequality in distribution of net assets among households, taking into account different socio-demographic characteristics of households, is discussed in the fourth chapter, whereas the fifth chapter includes the econometric model to establish which household characteristics affect the probability of having a household in a certain net asset quintile. Finally, the sixth chapter gives an overview of the main survey conclusions.
2 Implementation of the survey
The Croatian National Bank ordered the Household Finance and Consumption Survey (HFCS) and it was implemented by the Ipsos market research agency in cooperation with the Croatian Bureau of Statistics (CBS). The survey questionnaire was designed within the ECB research network and it was harmonized across EU member states. The survey, covering 2016, was carried out in Croatia from March to June 2017.
The stratification of private households from the population to the gross sample was carried out in two stages. 3 The first stage included stratification of segments according to occupied dwellings in spatial units of the country (belonging to the same municipality (city) or neighbourhood in the case of the City of Zagreb, in accordance with the enumeration areas from the 2011 Population Census). The segments were then divided into two groups depending on the size of the dwelling (up to 120m 2 and over 120m 2). In the second stage of sample stratification, the segments were divided according to the geographical location as follows: Adriatic Coast, Eastern Croatian and Central Croatia and according to the types of administrative units (city or municipality). Cities of Zagreb, Split and Rijeka formed separate strata. In this way, 16 different strata were obtained. After obtaining the strata, a certain number of segments proportional to their size were selected within each stratum. In this way, households had equal probability of selection, irrespective of the stratum they were assigned to. All in all, 16 strata contained 800 segments from 552 settlements. Finally, five occupied dwellings were randomly selected from each segment and this corresponds to the sample of 4000 occupied dwellings of 4070 households (according to the 2011 Census) that were included in the survey gross sample.
Vermeulen ( 2014; 2016) has shown that non-response due to wealth status may lead to underestimation of total assets estimated by the survey. To reduce the problem of non-response among wealthier households, Vermulen ( 2016) suggests oversampling of richer households by using some kind of measurement of household wealth as a selection criterion. In case of the HFCS for Croatia, for the purposes of the survey sampling process, the size of the dwelling (in square meters) was used as a measurement of household assets.
Households with dwellings over 120m 2 were thus represented in higher numbers, accounting for 25% of the gross sample. At the same time, they make up 10% of the overall population. In addition, households from the City of Zagreb, Split and Rijeka were also overrepresented in the gross sample (35% of the gross sample compared with 25% of the population) since, according to results from previous surveys, these cities were known for their low response rates. These methods were used to minimize underrepresentation of richer households in the sample. 4
The Computer Assisted Personal Interview – CAPI method was employed in the survey. A total of 1357 households from the gross sample took part in the survey so the response rate amounted to 33%. Given the relatively high unit non response and heterogeneity of response rate in different population segments (see Table 1), the net sample was weighted 5. The calculation of weight takes into account the probability of selection of households and heterogeneity of responses among different segments of population. Furthermore, all weights were additionally weighted to reflect age and sex distribution of population according to the 2011 Census.
Stochastic multiple imputation was used to compensate for the item non response that may be registered in the net sample of households. According to the ECB recommendations, the missing data within the net sample were imputed by using the €MIR methodology that implies that responses are missing at random so the missing data are replaced by several different values obtained by the estimates from the stochastic model 6. This methodology allows for several different final survey versions, the only difference being imputed values of the missing data. The sampling, weighting and imputing processes as described in the text above were carried out by the CBS in accordance with the guidelines of the ECB’s Household Finance and Consumption Network (HFCN). A total of five imputed survey versions with the accompanying weights were submitted to the CNB. Detailed information about the sample selection, survey implementation, questionnaire design and imputation and weighting of the results will be available in Jemrić and Vrbanc ( 2019). Additional information on the net sample is presented in the Appendix in Table A4.
The results presented in the paper underwent a statistical process as described in Boes ( 2006), designed for processing of multiple imputed data in Stata. In addition, the estimated weights were used in the descriptive analysis, but they were not applied in the estimation of the econometric model. 7
Table 1Structure of households in gross and net sample and in the overall population DISPLAY Table
3 Main components of household assets and liabilities8
The Table 2 shows the main components of household real and financial assets and liabilities. For each category of assets and liabilities under consideration, the data on the share of households with a certain category of assets/liabilities in the overall population are given, as well as their mean and median values. In addition, the Table 2 shows participation rate of each particular component in the total value of assets/liabilities, reflecting the relative importance of different categories of assets and liabilities for households. The presented values of all components of assets and liabilities reflect households’ subjective estimates that may not match real market values.
The figures shown in the Table 2 indicate that 98% of Croatian households own some kind of assets (real or financial) with the median value of 67 thousand euros. Of this, real assets account for 97% of the total asset value and financial assets for the remaining 3%. On the other hand, when interpreting these figures, it is important to note that the survey strongly underestimates the value of financial assets, because, according to financial accounts, the value of household-owned financial assets is approximately seven times higher. Yet, other data collected by the survey that allow for comparison with other data sources (e.g. the socio-demographic characteristics of households, the total income value and the share of household main residence ownership) are in line with the figures recorded in alternative dana sources (Jemrić and Vrbanc, 2019)).
Real assets portfolio includes different types of household-owned real estate, vehicles and other valuables (valuable jewellery, artwork, antiques etc.). A detailed analysis of components of real assets shows that, in terms of value, the HMR accounts for the largest share, i.e. 75% of the value of total real assets. In general terms, 85 % of households own the household main residence. The median value of the HMR amounts to 66 thousand euros. By comparing the data with those collected in the EU in the second survey wave (2013), one can observe higher participation rate of the household main residence in Croatia compared to other EU countries (where an average of 62% of households owned the HMR the median value of which stood at 165 thousand euros). On the other hand, similarly high share of HMR can be observed in other countries that implemented privatization of socially owned housing stock in the 1990s (Estonia, Slovenia, Slovakia – ECB, 2016).
More detailed analysis of HMR ownership data for Croatia shows that, of 85% of households with the main residence, 77% own the whole residence and the remaining 8% own some part of it. Also, renters account for 6% of households, whereas 9% use the HMR though they are not real owners. Substantial differences were observed among households in terms of how the HMR was acquired. In that respect, 36% of households built it, 34% inherited it or received it as a gift, 28% purchased it and the remaining 2% acquired it through a combination of these options.
Table 2Components of Household Assets and Liabilities DISPLAY Table
In respect of other components of household real assets, the survey results show that 23% of households own other real estate property whose median value was significantly lower compared with the HMR and stood at 20 thousand euros. Also, 69% of households owned vehicles whose median value amounted to 4 thousand euros per household. In terms of self-employment business assets, 5% of households reported it. Its median value was 25 thousand euros, compared to the substantially higher mean value of 209 thousand euros, which means that selfemployment business assets significantly contribute to the overall inequality.
Household financial assets are very homogeneous, in line with the results of the previous HFCS waves that found lack of diversification of financial assets in countries below the euro area average, such as Estonia, Slovakia, Slovenia, Portugal, Malta and Greece (Merikull and Room, 2016: 4). According to the survey results for Croatia, the median value of financial assets is 500 euros per household. Deposits account for the largest share (reported by 81% of households) with the median value of 300 euros. Highest participation rates were observed for sight account deposits (80%), compared with those for savings account deposits (14 % of households own it). Apart from deposits, other most important components of household-owned financial assets include shares in voluntary pension funds and whole life insurance (6%) and publicly traded shares (5%). Very low participation rates were observed for bonds, mutual funds, money owed to the household and other types of financial assets. Yet, these results should be interpreted with caution, since the aggregated values of financial assets from the HFCS point to seven times lower values compared with those registered in financial accounts.
The survey also collected detailed data on the liabilities of Croatian households. 9 In that sense, 41% of households are in some way indebted. Mortgage debt (66% of the total debt) is the most significant component of household debt, compared with non-mortgage debt (34%). Despite its high total value, the mortgage debt was not significantly distributed among households since only 9% of households reported it. The median value of the mortgage debt stood at 20 thousand euros. Low share of mortgage debt and high HMR ownership rates may be attributed to the transition process that the Croatian economy went through in 1990s. Back then, the vast majority of population (the elderly of today) acquired the household main residence through privatisation of socially owned housing stock. 10 Nonmortgage debt was reported by 36% of households. This type of debt mostly covers credit lines/overdrafts (reported by 27% of households) and other non-mortgage loans, with the median value of 2 thousand euros.
Net assets equal the amount of gross assets net of household liabilities. According to the survey results, the median value of household net assets stands at 61 thousand euros. The mean value stands at 107 thousand euros. The Figure 1A shows the distribution of net assets in percentiles, indicating that 5% of the poorest households have almost no assets. The value of net assets gradually increases above the 5th percentile up to the 75th percentile. Above the 75th percentile, the increase becomes more rapid, especially at the distribution tail above the 90th percentile. The Figure 1B shows the topology of most important types of household assets. It indicates that some households own several types of assets, e.g. the household main residence, other real estate and time deposits. However, these households represent a relatively small fraction (6%).
Figure 1ADistribution of net assets, in EUR thousands DISPLAY Figure Figure 1BTopology of household assets (most important components), share of households DISPLAY Figure
4 Inequality in the distribution of household net assets
Inequality in the distribution of household net assets is presented by using the Lorenz curve and Gini coefficient. In addition, since the existing literature on household inequality in Croatia is based on inequalities due to household income, the paper also presents the Lorenz curve of income on the basis of the data collected by the HFCS. The Lorenz curve is a graphical representation of inequality whereby the horizontal axis represents cumulative share of households and vertical axis cumulative share of household assets. In case of equal distribution of assets, the Lorenz curve would match the diagonal of the square (the so-called line of perfect equality). The lower the level of inequality, the closer the Lorenz curve is to the diagonal line, and vice versa, the higher the level, the farther away the curve is from the baseline. The Gini coefficient is a ratio of the area between the Lorenz curve and the diagonal of the square and the total triangle area below the diagonal line.
The Gini coefficient for total household net assets stands at 0.61, which indicates lower inequality in distribution of net assets among Croatian households compared with the euro average since the Gini coefficient for net household assets in the euro area amounts to 0.69, according to the results from the second HFCS wave from 2013 (ECB, 2016).
The Figure 2 shows more pronounced inequality in the distribution of financial assets (Gini coefficient of 0.88) compared with inequality in the distribution of real assets (Gini coefficient of 0.59). This is typical of countries with a high share of household main residence ownership (in case of Croatia, 85% according to survey results) that adds to significant prevalence of real assets among house holds. 11 Evident inequality in the distribution of financial assets is consistent with the results presented in CNB ( 2016), in which the Lorenz curve shows savings of natural persons in the Republic of Croatia in 2014.
The Gini coefficient for individual subcomponents of real and financial assets is presented in the Appendix in Table A5.
In terms of income, comparison of the distribution of assets and gross income among households suggests less pronounced inequality in the distribution of gross income compared with inequality in the distribution of real or financial assets (Gini coefficient of 0.51 for income). 12 Even though the concept of net income is mostly used in analyses on inequality and welfare, the HFCS collects the data on gross income only, i.e. including taxes and social insurance contributions, so the inequality in gross income is analysed in the remainder of the text. In that respect, the HFCS probably overestimates inequality in the distribution of gross income because a significant number of households reported no income and their annual gross income was zero (7%), whereas, at the same time, some of them possessed valuable assets. Since the total annual gross income includes employment income, rent, income from financial assets, pensions, social transfers or any other sources of income, this result indicates that the actual value of data presented in the responses was deliberately omitted. For this reason, the Gini coefficient for gross income was also estimated for the households whose annual gross income exceeds EUR 1,300 (the selected amount reflects the fact that a single-person household received a monthly minimum of HRK 800, i.e. the amount of the guaranteed minimum benefit (Zakon o socijalnoj skrbi, NN 152/14). The coefficient stands at 0.44.
Figure 2Lorenz curve for real, financial and net assets and income DISPLAY Figure
The availability of detailed survey data provides additional evaluation of interconnection between inequality in the distribution of net assets and different household characteristics. The analysis of the main socio-demographic characteristics of the household reference person 13, such as sex, educational attainment, age or labour market status, presented in the Figure 3, shows that the educational attainment can be related to the value of net assets and that households with highly educated reference persons have the largest share (30%) of persons with net asset value in the highest, fifth quintile. The share of persons in the highest asset quintile increases in proportion with the reference person’s age and slightly decreases once the reference person retires. In terms of labour market status, self-employed persons stand out given their largest share in the highest asset quintile (over 50% of the selfemployed classified in the fifth net asset quintile). On the other hand, relatively poor households make up the majority among the households with non-active reference persons. In that sense, over 50% of these households are in the lowest net asset quintile.
Figure 3Socio-demographic characteristics of households and quintiles of net assets, in % DISPLAY Figure
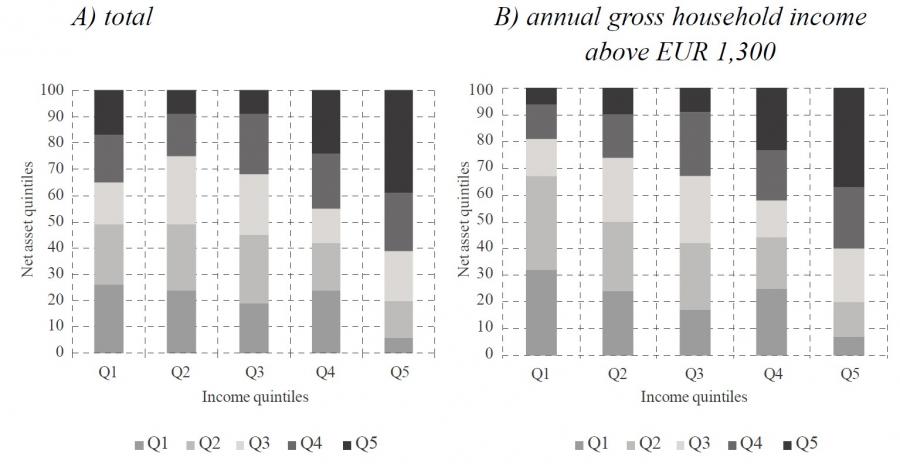
The educational attainment, labour market status and age are also connected with the level of household income, this income being a determinant of the value of net assets, which can be approximated by the savings from current income accumulated through time and increased by intergenerational transfers and gifts (for a detailed discussion, see Du Caju, 2016). The interconnection between income level and inequality in the distribution of net assets among households is shown in the Figure 4A. Top earning households (in the highest income quintile) are also among the wealthiest (40% of them are positioned in highest net asset quintile). Households in the lowest income quintile usually own low-value net assets, yet some of them have assets of high value (17% of households are both in the lowest income quintile and the highest asset quintile). Even though the literature offers several explanations of why some households are in the lowest income quintiles and the highest asset quintiles (such as a high proportion of pensioners in the first income quintile, who, despite having low current incomes, have accumulated a considerable amount of assets, or a potential impact of intergenerational transfers that are not related to the income level), a detailed decomposition of data has shown that these explanations do not apply to Croatian households. As previously explained, in the survey carried out in Croatia, quite a large number of households responded that they did not have income of any kind (7%), and, since, in line with the survey definition, annual gross income includes employment income, rent, income from financial assets, pensions, social transfers or any other sources of income, this result indicates that the actual value of data presented in the responses was deliberately omitted during the interview. 14 The Figure 4B therefore shows the distribution of assets and incomes for the households whose annual gross income exceeds EUR 1,300 (the amount of the guaranteed minimum benefit). However, even when households with annual gross income lower than EUR 1,300 are excluded from the sample, one can still observe households with very low incomes and high net asset values. This is why other factors that may affect inequality in the distribution of net assets are also examined.
Figure 4Joint distribution of income and net asse DISPLAY Figure
Recent research (Piketty, 2011; Zucman and Piketty, 2015) suggests that, irrespective of income, intergenerational transfers may substantially affect inequality in the distribution of net assets. In that sense, inherited household residence may play a pivotal role. The interconnection between the tenure status in terms of the HMR and the way the main residence, as the most important component of net assets, was acquired, including the total household net asset value, is shown in the Figures 5A i 5B. The Figure 5A shows that households that rent or freely use the main residence are among the poorest. On the other hand, the share of households that own the HMR increases from 5% among households with the lowest net assets to 95% among households whose net assets are the highest. In terms of ways of acquiring the household main residence, the Figure 5B shows that, among households in the lowest deciles of net assets, the largest proportion does not have the HMR, which comes as no surprise since this is the most valuable asset determinant. In the first decile of net assets, only 3% of households inherited the HMR. In other deciles, the share of these households remains relatively the same and amounts to 30% on average.
Figure 5AHousehold main residence – tenure status and deciles of net assets, in % DISPLAY Figure Figure 5BWay of acquiring the household main residence and deciles of net assets, in % DISPLAY Figure
Given the importance of the HMR value in total value of net assets, apart from the tenure status and the way of acquiring the HMR, the geographic location of main residence also has a significant effect on the value of total net household assets. The Croatian real estate market is known for pronounced regional heterogeneity and significant price differences depending on the geographic location of real estate (for more information see Tkalec, Vizek and Žilić, 2018 and CNB, 2019). Other economic trends 15 also reflect regional disparities, so the remainder of the paper provides an analysis of household net asset value depending on the geographic location of a particular household.
Figure 6ARegional heterogeneity of households with regard to the value of net assets DISPLAY Figure Figure 6BComparison of net asset percentiles for a household in the region and at the level of Croatia DISPLAY Figure
The Figure 6A shows that, on the Adriatic Coast and in the City of Zagreb, over 50% of households can be grouped among the 40% of the wealthiest, while the share of such households in Eastern Croatia is lower than 20%. In that sense, the poorest municipalities in Eastern Croatia stand out. These municipalities have over 60% of households classified among 40% of those with the lowest value of net assets at the level of Croatia. More detailed breakdown of inequality among various geographical locations in Croatia is shown in the Figure 5B, whereby the areas below the slope of 45 degrees in each observed percentile of assets have net asset values lower than those in the sample of the entire country. For instance, a household in the 50th percentile in terms of the net asset value in the municipalities of Eastern Croatia is also in the 30th percentile in terms of the net asset value at the level of Croatia. In other words, an average household in a municipality of Eastern Croatia is much poorer than the Croatian average. On the other hand, a household in the 50th percentile in terms of the net asset value in a geographical area comprising municipalities on the Adriatic Coast is in the 65th percentile in terms of the net asset value at the level of Croatia. One can draw a conclusion that an average household in a municipality on the Adriatic Coast is much wealthier than the Croatian average. These results point to marked regional heterogeneity in terms of the net asset value among households.
Descriptive statistics used in this chapter show that the value of total net household assets significantly varies among households, depending on the socio-demographic characteristics and household income, real estate ownership and geographic location of a particular household. However, a descriptive analysis alone cannot give us a more detailed insight into relative significance of different household characteristics and their impact on distribution of net assets among households. This is why an econometric model is used in the next chapter in order to examine in more detail the impact of different household characteristics on inequalities in the distribution of net household assets.
5 Analysis of the main determinants of inequalities in distribution of net assets
The purpose of this chapter is to establish the basic determinants of inequality in the distribution of net household assets.16 In line with the descriptive analysis carried out in the previous chapter, the dependent variable used for measuring inequality in the distribution of net assets is a quintile group for net assets that the household is assigned to with a value of 1 to 5.
Explanatory variables are divided into several main categories:
The impact of a household relative position in the income distribution on inequality in the distribution of net assets is taken into account by using a set of five dummy variables that take on value 1 if a household is positioned in a certain income quintile. By using the sample of countries that took part in the second HFCS wave, Arrondel, Roger and Savignac ( 2014) have shown that there was no unique link between income and asset distribution. In that respect, in some countries a rise in income implies a rise in household net assets, whereas in others, this link between income and asset distribution changes depending on the household relative position in the asset distribution.
Given the importance of HMR value for the total net asset value, as discussed in the previous chapter, the remainder of the analysis includes more detailed information on household main residence. Piketty ( 2011), Zucman and Piketty ( 2015), among others, think that inheritance is crucial for establishing value of household net assets. In addition, the data collected in the two previous HFCS waves (ECB, 2013; 2016) also emphasise the important role of inheritance in establishing value of net assets. This is why the analysis also includes a dummy variable that takes on value 1 if a household reported that they inherited the main residence or received it as a gift. In addition, given the heterogeneity in terms of HMR value among different geographic locations in Croatia, a set of four dummy variables is created, designating the geographic location of household main residence and the household (Adriatic Coast, Central Croatia, Eastern Croatia and the City of Zagreb). Mathä, Porpiglia and Ziegelmeyer ( 2014) use the Oaxaca – Blinder decomposition and show that differences in property prices across euro area countries are the most important factor for explaining differences in household net asset values. Sociodemographic characteristics of households are based on the data on the reference person chosen by household members as the person most informed about household finances. The analysis includes a set of dummy variables for reference person’s age (age groups: 16-34, 35-45, 45-64 and over 65). Hammer ( 2015) has analysed age-specific household balance sheet depending on the reference person’s age and has shown that household assets increase in proportion with the reference person’s age and slightly decreases once the reference person retires. 17 Another element used in the analysis is the reference person’s sex. A dummy variable that takes on value 1 if the reference person is male was thus created. Previous research (Sierminska, Frick and Grabka, 2017) has shown that households whose reference person is a man may have higher net asset value. The effect of the reference person’s education was examined by using three dummy variables classifying reference persons into three groups: persons with primary education or with no education, those with secondary education and those with higher education. The effect of the reference person’s labour market status on inequality in the distribution of net assets is measured by using a set of dummy variables assigning reference persons into one of the following categories: self-employed, employed, retired and unemployed or non-active. Lise ( 2011) points to the fact that inequality in distribution of assets is affected by the labour market status, with unemployed and non-active individuals in a significantly disadvantaged position.
Socio-demographic characteristics of households include dummy variables that describe household structure, such as total number of household members and number of dependent children, because we expect positive correlation between the total number of household members and the net asset value and negative correlation in terms of number of dependent children in the household. Fessler, Linder and Segalla ( 2014) show that appropriate analysis of net assets should include variables to control for household structure.
In addition, the analysis includes other household characteristics, such as the dummy variable measuring household willingness to take risks (that takes on value 1 if a household reported willingness to take substantial or significant financial risks when making savings or investment decisions) and the dummy variable that equals 1 if a household receives some kind of social benefits. Fessler and Schürz ( 2015) and Jappelli ( 1995) show that social services provided by the state are substitutes for private wealth accumulation and households that receive some kind of social benefits have substantially lower net asset values compared with other households.
Finally, two dummy variables were used to examine the role of debt in accumulation of net assets for households with mortgage loans collateralised with the household main residence (HMR) and households with consumer debt. 18
Apart from the above-mentioned variables, the Appendix Tables A6, A7 and A8 shows the results of the robustness analysis with alternative selection of variables. Since households whose annual income did not exceed EUR 1,300 (Chapter 3) accounted for a relatively high share in the sample, the paper presents the estimates of the model without households with income below EUR 1,300. By using the new sample, the cut-off values were estimated to position each household in the corresponding income and net assets quintiles. The additional robustness analysis was carried out by using an alternative specification of household income adjusted for the number of household members according to the OECD equivalence scale (OECD, 2011). The results of the robustness analysis are in line with the main results of the model. The text below explains the construction of the model used to estimate the effects of the above-mentioned set of explanatory variables on a household position in distribution of net assets.
5.1 Methodology – the generalized ordered probit model
We use the generalized ordered probit model in the econometric estimation. The model is based on a latent dependent variable Ii* defined as: where i = 1, ..., n indexes the households in the sample and j ϵ {1,2, ..., J} indexes the categories of the probit model.
Observable variable Ii can assume the values defined within the set {1,2, ..., J}
where J = 5. The observable variable is defined as follows: Ii = 1 if Ii* ≤ K1 Ii = j if Kj–1 ≤ Ii* ≤ Kj for j = {2,..., J – 1} Ii = J if Ii* ≥ Kj–1
| (2) |
where Kj represents estimated cut-off values that position each household in the corresponding net asset quintile.
In that respect, the probability that a household i is positioned in one of the J categories reflecting net asset quintile is defined as follows: and Pr (Ii = 1) = F(Xi β1)
Pr (Ii = j) = F(Xi βj) – F(Xi βj–1) for j = {2,..., J – 1}
Pr (Ii = J) = 1 – F(Xi βj–1)
| (3) |
where F equals a normal cumulative distribution function.
The generalized ordered probit model is selected as opposed to the ordered probit model as a preferred model specification because it allows for heterogeneous effect of the independent variables on the dependent subject to different categories of dependent variable (Williams, 2006; Green and Hensher, 2010). This is why in the generalized model the estimated parameters βj vary between j categories of the dependent variable (net asset quintiles for households). If we want to have estimated coefficients βj equal for each of j values of the dependent variable categories, the end result would be the ordered probit model. The ordered probit model would assume linear effect of all independent variables on the dependent variable. For instance, the income effect would be equal to establish the probability of positioning a household in both the second and fifth net asset quintile. Since the Wald test of the parallel line assumption rejects the homogeneity assumption for the estimated parameters, it is more appropriate to use the generalized ordered probit model as opposed to the ordered probit model in the analysis (test results shown in the Appendix in Tables A6, A7 and A8). Also, the same tables presents the results of the least squares method estimate with net asset value (log) as the dependent variable. On the other hand, the use of linear regression also assumes linear effect of all independent variables on the dependent variable, but the previous univariate analysis has shown that the structure of relevant household characteristics substantially changes depending on the household position in the distribution of net assets. For these reasons, the generalized ordered probit model was selected as the primary methodological tool because it allows for non-linear effect of independent variable depending on different categories of the dependent variable.
5.2 Main results
The text below presents the main results of the estimate of the generalized ordered probit model as defined in the equation (3). Since the regression coefficients cannot be interpreted as marginal effects within the probit model, the Table 3 presents the marginal effects that show the effect of the unit change of the explanatory variables on the probability of positioning a household in a particular net asset quintile. Given that the marginal effect may differ for different values of explanatory variables, the marginal effect in accordance with the mean value of explanatory variables is thus presented.
Table 3Probability of positioning a household in a certain net asset quintile* DISPLAY Table
The main results are presented in the text below.
The empirical analysis has confirmed the link between a household position in the distribution of income and net assets. The estimated marginal effects for income mostly have the expected sign. Low income households are more likely to be in lower and less likely to be in higher net asset quintiles. For instance, a household in the first income quintile is 14% more likely to be positioned in the first net asset quintile as well and 20% less likely to be in the fifth (highest) net asset quintile, in comparison with a household in the fifth income quintile. Regardless of a certain connection between income and net asset value, statistical significance and link intensity vary, depending on a household position in terms of the distribution of assets. This leads us to conclude that inequality in distribution of assets can only partially be attributed to the income levels among households and that some other factors, apart from income, may have a relevant impact on a household position in the distribution of net assets. 19
The results of the estimated model show that information on the household main residence (HMR) remains significant when establishing a household position in the distribution of net assets. In that respect, inherited HMR decreases the likelihood of positioning the household in the lowest net asset quintile (by 11%) and increases the likelihood of positioning it in somewhat higher net asset quintiles (second and third net asset quintile). On the other hand, the inherited main residence does not affect the likelihood of having a household in the wealthiest quintiles because the results for the fourth and fifth net asset quintile are not statistically significant for this variable.
The location of HMR is extremely important to establish a household position in the distribution of net assets. All other factors being constant, households with the household main residence on the Adriatic Coast or in the City of Zagreb are much less likely to be in lower net asset quintiles (second and third quintiles) and more likely to be in higher net asset quintiles (fourth and fifth quintiles) compared with households in Eastern Croatia that make up the reference category. It should be noted, however, that, irrespective of the important effect of geographic location of the HMR on a household position in the distribution of net assets, a location does not have a significant effect on the likelihood of positioning a household in the poorest (first) net assets quintile. This is in line with the previous descriptive analysis that has shown that the majority of households in the lowest net asset quintile do not even own the HMR.
In terms of socio-demographic characteristics, the labour market status only partially affects the probability of positioning a household in a certain net asset quintile. For instance, households with self-employed persons are 24% less likely to be in the poorest quintile and 23% more likely to be in the wealthiest net asset quintile compared with households with an employed reference person. This is in line with the findings of the descriptive analysis that point to high values of selfemployment business assets and inequality of its distribution among households. In terms of other categories of labour market status, the results have the expected sign but they are not statistically significant. The only exception are households with a retired reference person that are 9% more likely to be in the highest net asset quintile in comparison with households with an employed reference person.
Households with higher educational attainment and older age of the reference persons are more likely to be positioned in higher asset quintile. For example, highly educated reference persons and those with secondary education are (19% and 14% respectively) less likely to be in the poorest quintile and (20% and 12% respectively) more likely to be in the highest net asset quintile compared with reference persons with primary education or no education. Households with older reference persons (+65) are much less likely to be in the poorest net asset quintile and more likely to be in the wealthiest net asset quintile in comparison with households whose reference person is below 35. A similar effect, though somewhat more moderate, was also observed for households with middle aged reference person (45-64 age group). The analysis has also emphasised the importance of household characteristics for its position in the distribution of net assets with households with more children and fewer household members more likely to be in poorer net asset quintiles and vice versa.
Finally, the results have shown that households that reported perceived willingness to take financial risks are more likely to be in the highest net asset quintile whereas households that receive social benefits and indebted households are more likely to be in poorer net asset quintiles (whereby households with consumer debt are more likely to be in the lowest net asset quintile).
6 Conclusion
The household finance and consumption survey (HFCS) was used in this paper to analyse the distribution of household net assets and its main components. The results reveal moderate inequality in the distribution of net assets among Croatian households. Inequality in possession of financial assets measured by the Gini coefficient is more pronounced than in case of real assets because only a certain portion of households own substantial financial assets. The median value of households’ financial assets stands at EUR 500. Real assets account for a large share of households’ total assets and 85% of households own the household main residence (HMR) that makes up the bulk of households’ total net assets with 66 thousand euros in median value. The value of total net household assets considerably varies among households depending on their different social and demographic characteristics, income, real asset ownership and geographic location.
The results of the econometric model indicate that interaction of numerous factors affects a household position in the distribution of net assets. In that sense, the importance of HMR stands out. The main residence represents the most significant component of value of net assets, especially in terms of the way it was acquired and geographic location. Households with inherited HMR are less likely to be positioned in the lowest net asset quintile. In addition, households with HMR in the City of Zagreb or on the Adriatic Coast are more likely to be in higher asset quintile groups.
Households with higher income and educational attainment and older age of the reference persons are more likely to be positioned in highest net asset quintiles. The same effect was found for financial risk taking and self-businesses (self-employment) because these characteristics were linked to the likelihood of having a household in highest net asset quintiles. On the other hand, households with more children, those that receive social benefits and those with poorly educated and younger reference person are most likely to be in the poorest net asset quintiles.
In that sense, this paper represents the first attempt to estimate inequality in the distribution of assets in Croatia and the accompanying factors affecting it. As a follow-up, it is crucial to compare the collected data with other survey and administrative data sources (tax administration, CBS) and continue with systematic collection of assets data and further research in terms of inequality in the distribution of assets given that there are currently few analyses of this type in Croatia.
Appendix
Table A4Comparison of socio-demographic characteristics of households* DISPLAY Table Table A5Gini coefficient for subcomponents of real and financial assets DISPLAY Table Table A6Probability of positioning a household in a certain net asset quintile* DISPLAY Table Table A7Probability of positioning a household in a certain net asset quintile* DISPLAY Table Table A8Least squares estimator (Models 1 and 2) and ordered probit DISPLAY Table
Notes
* The author wants to thank the two anonymous referees, as well as Maja Bukovšak, Vedran Šošić, Krunoslav Zauder, Mate Rosan, Ervin Duraković, Lana Ivičić and Ivica Rubil for their useful comments and suggestions. I would like to express my gratitude to Mrs Frédérique Savignac from the HFCN, the co-author in the paper by Arrondel, Roger and Savignac (2014) for providing a part of the Stata module to integrate generalized ordered probit models with multiple imputed and weighted data. This paper presents the views of the author and should not be interpreted as reflecting the views or opinions of the Croatian National Bank.
1 The Household Finance and Consumption Survey (HFCS) was carried out in coordination with the Euro¬pean Central Bank. The European Central Bank has already coordinated two previous HFCS waves, the first one in the 2008-2010 period and the second in 2013. Since Croatia entered the EU in July 2013, the CNB joined the survey in the third wave.
2 By comparing the data with those collected in the EU in the second survey wave (2013), one can observe higher participation rate of the household main residence in Croatia compared to other EU countries (where an average of 62% of households owned the HMR the median value of which stood at 165 thousand euros (ECB, 2016)).
3 According to the HFCS methodology prescribed by the ECB, the survey did not cover institutional households.
4 Recent studies (e.g. Blanchet, Flores and Morgan, 2018) indicate that the combination of survey and tax data represent the most detailed adjustment in case of underrepresentation of richer households in wealth surveys. The authors propose a statistical procedure that combines survey income microdata and tax data on the num¬ber of taxpayers by income brackets, which gives a new adjusted dataset with new weights and observations with adjusted income values. At the same time, all the other survey data remain consistent.
5 To take into account unequal probability of participation in the sample among households.
6 Models for estimation of missing values for particular variables are pre-defined within the HFCN.
7 A similar approach was applied in Arrondel, Roger and Savignac (2014) and Georgokoponus (2019). Weights are based on the data on geographic distribution of households and respondents’ age and sex. Controlling for these variables in the model is achieved by their direct inclusion in the regression.
8 The selected parts of the Chapter were presented in CNB (2019).
9 Details on household liabilities collected in the HFCS are described in the CNB (2019) and Rosan and Zauder (2019). Household debt distribution in Croatia had previously been analysed by Herceg and Šošić (2011) and Herceg and Nestić (2014). However, these analyses were based on the Household Consumption Survey of the CBS. The survey included micro debt data and the main socio-demographic characteristics of households. On the other hand, the data on assets (real or financial) were not available.
10 Privatization of the socially owned housing stock was implemented in accordance with the Act on the Sale of Apartments with Tenancy Rights (Zakon o prodaji stanova nad kojima postoji stanarsko pravo, NN 27/91).
11 Austria is is an interesting example in that sense where inequality in the distribution of financial assets is lower than inequality in the distribution of real assets, given the low share of main residence ownership (45%). For more details, see Fessler, Linder and Schurz (2019).
12 The data from the CBS Statistics on Income and Living Conditions (SILC) for 2016 point to somewhat lower income inequality in Croatia, but in case of the CBS SILC, the Gini coefficient is significantly lower and stands at 0.3 (CBS, 2017). The results are not completely comparable because the Gini coefficient from CBS SILC covers net income, whereas all the data collected in the HFCS relate to gross amounts, i.e. includ-ing taxes and social insurance contributions.
13 The reference person is the one chosen by household members as the person most informed about household finances.
14 Income components included in the definition of the annual gross income and components of all the other variables whose values are collected in the survey are available in CNB (2019).
15 For more details see Christiaensen et al. (2019).
16 Selection of dependent variables and methodological approach is similar to those presented in Arrondel, Roger and Savignac (2014), Martinez and Uribe (2018) and Georgokoponus (2019).
17 In line with the life-cycle hypothesis according to Modigliani and Brumberg (1954).
18 For the discussion on the effect of debt and different types of social benefits on inequality in the distribu¬tion of assets, see Maestri, Bogliacino and Salverda (2014).
19 Other research has also backed this result (e.g. Arrondel, Roger and Savignac, 2014; Leitner, 2015).
* The author wants to thank the two anonymous referees, as well as Maja Bukovšak, Vedran Šošić, Krunoslav Zauder, Mate Rosan, Ervin Duraković, Lana Ivičić and Ivica Rubil for their useful comments and suggestions. I would like to express my gratitude to Mrs Frédérique Savignac from the HFCN, the co-author in the paper by Arrondel, Roger and Savignac ( 2014) for providing a part of the Stata module to integrate generalized ordered probit models with multiple imputed and weighted data. This paper presents the views of the author and should not be interpreted as reflecting the views or opinions of the Croatian National Bank.
1 The Household Finance and Consumption Survey (HFCS) was carried out in coordination with the Euro¬pean Central Bank. The European Central Bank has already coordinated two previous HFCS waves, the first one in the 2008-2010 period and the second in 2013. Since Croatia entered the EU in July 2013, the CNB joined the survey in the third wave.
2 By comparing the data with those collected in the EU in the second survey wave (2013), one can observe higher participation rate of the household main residence in Croatia compared to other EU countries (where an average of 62% of households owned the HMR the median value of which stood at 165 thousand euros (ECB, 2016)).
3 According to the HFCS methodology prescribed by the ECB, the survey did not cover institutional households.
4 Recent studies (e.g. Blanchet, Flores and Morgan, 2018) indicate that the combination of survey and tax data represent the most detailed adjustment in case of underrepresentation of richer households in wealth surveys. The authors propose a statistical procedure that combines survey income microdata and tax data on the num¬ber of taxpayers by income brackets, which gives a new adjusted dataset with new weights and observations with adjusted income values. At the same time, all the other survey data remain consistent.
5 To take into account unequal probability of participation in the sample among households.
6 Models for estimation of missing values for particular variables are pre-defined within the HFCN.
7 A similar approach was applied in Arrondel, Roger and Savignac ( 2014) and Georgokoponus ( 2019). Weights are based on the data on geographic distribution of households and respondents’ age and sex. Controlling for these variables in the model is achieved by their direct inclusion in the regression.
8 The selected parts of the Chapter were presented in CNB ( 2019).
9 Details on household liabilities collected in the HFCS are described in the CNB ( 2019) and Rosan and Zauder ( 2019). Household debt distribution in Croatia had previously been analysed by Herceg and Šošić ( 2011) and Herceg and Nestić ( 2014). However, these analyses were based on the Household Consumption Survey of the CBS. The survey included micro debt data and the main socio-demographic characteristics of households. On the other hand, the data on assets (real or financial) were not available.
10 Privatization of the socially owned housing stock was implemented in accordance with the Act on the Sale of Apartments with Tenancy Rights (Zakon o prodaji stanova nad kojima postoji stanarsko pravo, NN 27/91).
11 Austria is is an interesting example in that sense where inequality in the distribution of financial assets is lower than inequality in the distribution of real assets, given the low share of main residence ownership (45%). For more details, see Fessler, Linder and Schurz ( 2019).
12 The data from the CBS Statistics on Income and Living Conditions (SILC) for 2016 point to somewhat lower income inequality in Croatia, but in case of the CBS SILC, the Gini coefficient is significantly lower and stands at 0.3 (CBS, 2017). The results are not completely comparable because the Gini coefficient from CBS SILC covers net income, whereas all the data collected in the HFCS relate to gross amounts, i.e. includ-ing taxes and social insurance contributions.
13 The reference person is the one chosen by household members as the person most informed about household finances.
14 Income components included in the definition of the annual gross income and components of all the other variables whose values are collected in the survey are available in CNB ( 2019).
15 For more details see Christiaensen et al. ( 2019).
16 Selection of dependent variables and methodological approach is similar to those presented in Arrondel, Roger and Savignac ( 2014), Martinez and Uribe ( 2018) and Georgokoponus ( 2019).
17 In line with the life-cycle hypothesis according to Modigliani and Brumberg ( 1954).
18 For the discussion on the effect of debt and different types of social benefits on inequality in the distribu¬tion of assets, see Maestri, Bogliacino and Salverda ( 2014).
19 Other research has also backed this result (e.g. Arrondel, Roger and Savignac, 2014; Leitner, 2015).
Disclosure statement
No potential conflict of interest was reported by the author.
References
Arrondel, L., Roger, M. and Savignac, F., 2014. Wealth and income in the euro area Heterogenity in households' behaviour. ECB Working Paper, No. 1709.
Auclert, A., 2017. Monetary policy and the redistributional channel. NBER Working Paper, No. 23451 [ CrossRef]
Boes, S., 2006. REGOPROB: Stata module to estimate random effects generalized ordered probit models. Statistical Software Components S456604. Boston: Boston College Department of Economics.
CBS, 2017. Statistics on Income and Living Conditions (SILC), 2016 Indicators of Poverty and Social Exclusion in 2016. Zagreb: Croatian Bureau of Statistics.
Christiaensen, L. [et al.], 2019. Jobs Challenges in Slavonia, Croatia – A Subnational Labor Market Assessment. World Bank Group, Jobs Working Paper No. 35 [ CrossRef]
Fessler, P. and Schürz, M., 2015. Private Wealth across European Countries: The role of income, Inheritance and the Welfare State. ECB Working Paper, No. 1847.
Fessler, P., Linder, P. and Segalla, E., 2014. Net Wealth Across the Euro Area –Why Household Structure Matters and How to Control for It. ECB Working Paper, No. 1663.
Green, W. and Hensher, D., 2010. Modeling Ordered Choices. New York: Cambridge University Press [ CrossRef]
Herceg, I. and Nestić, D., 2014. A New Cluster-Based Financial Vulnerability Indicator and Its Application to Household Stress Testing in Croatia. Emerging markets finance and trade, 50(5), pp. 60-77 [ CrossRef]
Herceg, I. and Šošić, V., 2011. The Anatomy of Household in Croatia: Enlisting More Creditworthy Households or Relaxing Lending Standards? Comparative Economic Studies, 53, pp. 199-221 [ CrossRef]
Jappelli, T., 1995. Does social security reduce the accumulation of private wealth? Evidence from Italian survey data. Ricerche Economiche, 49, pp. 1-31 [ CrossRef]
Jemrić, I. and Vrbanc, I., 2019. Anketa o financiranju i potrošnji kućanstava. In preparation.
Kontbay-Busun, S. and Peichl, A., 2015. Multidimensional Affluence in Income and Wealth in the Eurozone: A Cross-Country Comparison Using the HFCS. IZA Discussion Paper, No. 9139 [ CrossRef]
Lise, J., 2011. On-the-Job Search and Precautionary Savings: Theory and Empirics of Earnings and Wealth Inequality. Institute for Fiscal Studies, WP 11-2016 [ CrossRef]
Maestri, V., Bogliacino, F. and Salverda, W., 2014. Wealth Inequality and the Accumulation of Debt. In: W. Salverda [et al.]. Changing Inequalities in Rich Countries: Analytical and Comparative Perspectives [ CrossRef]
Mathä, T. J., Porpiglia, A. and Ziegelmeyer, M., 2014. Household wealth in the euro area: The importance of intergenerational transfers, home ownership and house price dynamics. ECB Working Paper, 1690 [ CrossRef]
Merikull, J. and Room, T., 2016. The assets, liabilities and wealth of Estonian households: Results of the Household Finance and Consumption Survey. Eesti Pank, Occasional Paper, 3-2016 [ CrossRef]
Modigliani, F. and Brumberg, R., 1954. Utility analysis and the Consumption Function: an Interpretation of Cross-section Data. In: K. Kurihara. Post-Keynesian Economics. New Brunswick: Rutgers University Press, pp. 388-436.
Piketty, T., 2011. On the Long-Run Evolution of Inheritance: France 1820 - 2050. The Quarterly Journal of Economics, 3(126), pp. 1071-1131 [ CrossRef]
Rosan, M. and Zauder K., 2019. A Micro-level Analysis of Croatian Households' Debt Participation. In preparation.
Rubil, I., 2013. Razlike u siromaštvu na razini regija u Hrvatskoj: uloga razlika u prosječnim dohocima i nejednakostima distribucije dohodaka. Radni materijali EIZ-a, No. 1.
Rubil, I., Stubbs, P. and Zrinščak, S., 2018. Child Poverty and Household Coping Strategies in Croatia: A Quantitative-Qualitative Study. Privredna kretanja i ekonomska politika, 26(2) (141), pp. 59 – 116 [ CrossRef]
Sierminska, E. and Medgyesi M., 2013. The distribution of wealth between households. European Commission Research Note, 11.
Sierminska, E., Frick J. R. and Grabka, M. M., 2010. Examining the gender wealth gap. Oxford Economic Papers, 62(4), pp. 669-690 [ CrossRef]
Tzamourani, P., 2019. The interest rate exposure of euro area households. Deutsche Bundesbank Discussion Paper, No. 1-2019 [ CrossRef]
Williams, R., 2006. Generalized Ordered Logit/partial Proportional Odds Models for Ordinal Dependent Variables. The Stata Journal, 6, pp. 58-82 [ CrossRef]
Zakon o prodaji stanova nad kojima postoji stanarsko pravo, NN 27/91. Zagreb: Narodne novine.
Zakon o socijalnoj skrbi, NN 152/14. Zagreb: Narodne novine.
Arrondel, L., Roger, M. and Savignac, F., 2014. Wealth and income in the euro area Heterogenity in households' behaviour. ECB Working Paper, No. 1709.
Auclert, A., 2017. Monetary policy and the redistributional channel. NBER Working Paper, No. 23451 [ CrossRef]
Boes, S., 2006. REGOPROB: Stata module to estimate random effects generalized ordered probit models. Statistical Software Components S456604. Boston: Boston College Department of Economics.
CBS, 2017. Statistics on Income and Living Conditions (SILC), 2016 Indicators of Poverty and Social Exclusion in 2016. Zagreb: Croatian Bureau of Statistics.
Christiaensen, L. [et al.], 2019. Jobs Challenges in Slavonia, Croatia – A Subnational Labor Market Assessment. World Bank Group, Jobs Working Paper No. 35 [ CrossRef]
Fessler, P. and Schürz, M., 2015. Private Wealth across European Countries: The role of income, Inheritance and the Welfare State. ECB Working Paper, No. 1847.
Fessler, P., Linder, P. and Segalla, E., 2014. Net Wealth Across the Euro Area –Why Household Structure Matters and How to Control for It. ECB Working Paper, No. 1663.
Green, W. and Hensher, D., 2010. Modeling Ordered Choices. New York: Cambridge University Press [ CrossRef]
Herceg, I. and Nestić, D., 2014. A New Cluster-Based Financial Vulnerability Indicator and Its Application to Household Stress Testing in Croatia. Emerging markets finance and trade, 50(5), pp. 60-77 [ CrossRef]
Herceg, I. and Šošić, V., 2011. The Anatomy of Household in Croatia: Enlisting More Creditworthy Households or Relaxing Lending Standards? Comparative Economic Studies, 53, pp. 199-221 [ CrossRef]
Jappelli, T., 1995. Does social security reduce the accumulation of private wealth? Evidence from Italian survey data. Ricerche Economiche, 49, pp. 1-31 [ CrossRef]
Jemrić, I. and Vrbanc, I., 2019. Anketa o financiranju i potrošnji kućanstava. In preparation.
Kontbay-Busun, S. and Peichl, A., 2015. Multidimensional Affluence in Income and Wealth in the Eurozone: A Cross-Country Comparison Using the HFCS. IZA Discussion Paper, No. 9139 [ CrossRef]
Lise, J., 2011. On-the-Job Search and Precautionary Savings: Theory and Empirics of Earnings and Wealth Inequality. Institute for Fiscal Studies, WP 11-2016 [ CrossRef]
Maestri, V., Bogliacino, F. and Salverda, W., 2014. Wealth Inequality and the Accumulation of Debt. In: W. Salverda [et al.]. Changing Inequalities in Rich Countries: Analytical and Comparative Perspectives [ CrossRef]
Mathä, T. J., Porpiglia, A. and Ziegelmeyer, M., 2014. Household wealth in the euro area: The importance of intergenerational transfers, home ownership and house price dynamics. ECB Working Paper, 1690 [ CrossRef]
Merikull, J. and Room, T., 2016. The assets, liabilities and wealth of Estonian households: Results of the Household Finance and Consumption Survey. Eesti Pank, Occasional Paper, 3-2016 [ CrossRef]
Modigliani, F. and Brumberg, R., 1954. Utility analysis and the Consumption Function: an Interpretation of Cross-section Data. In: K. Kurihara. Post-Keynesian Economics. New Brunswick: Rutgers University Press, pp. 388-436.
Piketty, T., 2011. On the Long-Run Evolution of Inheritance: France 1820 - 2050. The Quarterly Journal of Economics, 3(126), pp. 1071-1131 [ CrossRef]
Rosan, M. and Zauder K., 2019. A Micro-level Analysis of Croatian Households' Debt Participation. In preparation.
Rubil, I., 2013. Razlike u siromaštvu na razini regija u Hrvatskoj: uloga razlika u prosječnim dohocima i nejednakostima distribucije dohodaka. Radni materijali EIZ-a, No. 1.
Rubil, I., Stubbs, P. and Zrinščak, S., 2018. Child Poverty and Household Coping Strategies in Croatia: A Quantitative-Qualitative Study. Privredna kretanja i ekonomska politika, 26(2) (141), pp. 59 – 116 [ CrossRef]
Sierminska, E. and Medgyesi M., 2013. The distribution of wealth between households. E uropean Commission Research Note, 11.
Sierminska, E., Frick J. R. and Grabka, M. M., 2010. Examining the gender wealth gap. Oxford Economic Papers, 62(4), pp. 669-690 [ CrossRef]
Tzamourani, P., 2019. The interest rate exposure of euro area households. Deutsche Bundesbank Discussion Paper, No. 1-2019 [ CrossRef]
Williams, R., 2006. Generalized Ordered Logit/partial Proportional Odds Models for Ordinal Dependent Variables. The Stata Journal, 6, pp. 58-82 [ CrossRef]
Zakon o prodaji stanova nad kojima postoji stanarsko pravo, NN 27/91. Zagreb: Narodne novine.
Zakon o socijalnoj skrbi, NN 152/14. Zagreb: Narodne novine.
|
|
|
September, 2020
III/2020
|


