7477
Views
364
Downloads |
The euro and inflation in Croatia: much ado about nothing?
Petar Sorić* 
Article | Year: 2024 | Pages: 1 - 37 | Volume: 48 | Issue: 1 Received: June 1, 2023 | Accepted: October 25, 2023 | Published online: March 1, 2024
|

FULL ARTICLE
FIGURES & DATA
REFERENCES
CROSSMARK POLICY
METRICS
LICENCING
PDF
Note: Vertical dotted line corresponds to September 2022 (start of obligatory dual display of
prices). Vertical full line corresponds to January 2023 (euro changeover). Inflation expectations
are quantified as the response balance to question 6 from the EU Consumer Survey (see section
3 for details). Source: Eurostat and European Commission.
|
January
|
February
|
March
|
April
|
May
|
June
|
July
|
|
hicp
|
1.704
|
0.974
|
1.589
|
0.508
|
1.199
|
2.062
|
2.038
|
|
(0.038)
|
(0.291)
|
(0.155)
|
(0.601)
|
(0.235)
|
(0.038)
|
(0.014)
|
|
food
|
0.065
|
0.203
|
0.823
|
2.748
|
3.927
|
4.889
|
3.615
|
|
(0.986)
|
(0.934)
|
(0.648)
|
(0.127)
|
(0.019)
|
(0.005)
|
(0.028)
|
|
nonalc
|
0.202
|
-1.845
|
-1.570
|
-0.002
|
1.971
|
3.038
|
2.653
|
|
(0.864)
|
(0.315)
|
(0.390)
|
(0.977)
|
(0.296)
|
(0.089)
|
(0.113)
|
|
alc
|
1.077
|
-0.522
|
-2.041
|
-1.794
|
-1.449
|
-1.294
|
-1.374
|
|
(0.577)
|
(0.826)
|
(0.282)
|
(0.343)
|
(0.498)
|
(0.545)
|
(0.516)
|
|
clothing
|
8.225
|
5.901
|
3.294
|
3.419
|
2.121
|
4.385
|
7.374
|
|
(0.005)
|
(0.014)
|
(0.202)
|
(0.174)
|
(0.441)
|
(0.094)
|
(0.005)
|
|
housing
|
4.362
|
3.626
|
0.800
|
-1.105
|
-1.182
|
-0.703
|
-0.086
|
|
(0.244)
|
(0.371)
|
(0.930)
|
(0.718)
|
(0.681)
|
(0.812)
|
(0.953)
|
|
furnish
|
1.463
|
1.014
|
0.181
|
-1.211
|
0.699
|
1.165
|
2.154
|
|
(0.061)
|
(0.197)
|
(0.817)
|
(0.117)
|
(0.380)
|
(0.131)
|
(0.019)
|
|
health
|
2.386
|
1.795
|
1.539
|
1.782
|
2.831
|
4.098
|
4.364
|
|
(0.188)
|
(0.324)
|
(0.385)
|
(0.366)
|
(0.169)
|
(0.023)
|
(0.019)
|
|
transport
|
-0.835
|
-0.373
|
-0.761
|
-1.722
|
-1.421
|
0.198
|
1.109
|
|
(0.577)
|
(0.751)
|
(0.592)
|
(0.300)
|
(0.352)
|
(0.901)
|
(0.479)
|
|
commun
|
-1.623
|
-1.662
|
-1.034
|
-0.097
|
0.167
|
-0.979
|
1.647
|
|
0.277)
|
(0.277)
|
(0.521)
|
(0.962)
|
(0.911)
|
(0.540)
|
(0.291)
|
|
recr
|
-0.802
|
-2.032
|
-3.410
|
-3.965
|
-4.310
|
-3.545
|
-0.533
|
|
(0.549)
|
(0.188)
|
(0.056)
|
(0.033)
|
(0.023)
|
(0.075)
|
(0.789)
|
|
educ
|
1.970
|
1.718
|
2.299
|
2.465
|
2.084
|
2.683
|
3.560
|
|
(0.235)
|
(0.277)
|
(0.192)
|
(0.178)
|
(0.239)
|
(0.174)
|
(0.061)
|
|
rest
|
4.340
|
3.701
|
4.391
|
5.276
|
6.890
|
9.087
|
7.024
|
|
(0.028)
|
(0.052)
|
(0.038)
|
(0.038)
|
(0.014)
|
(0.005)
|
(0.009)
|
|
misc
|
1.501
|
-0.049)
|
0.269
|
0.298
|
1.219
|
0.915
|
0.930
|
|
(0.103)
|
(0.930)
|
(0.756)
|
(0.732)
|
(0.188)
|
(0.371)
|
(0.366)
|
Note: Table entries are gaps between actual and synthetic values of corresponding variables. Positive gaps imply that actual values are greater than the synthetic ones. P-values are given in parentheses. Bold entries are significant at the 5% level. Source: Author’s calculation.
|
January
|
February
|
March
|
April
|
May
|
June
|
July
|
|
hicp
|
0.862
|
0.220
|
-0.439
|
-1.225
|
-0.348
|
0.700
|
0.905
|
|
(0.315)
|
(0.817)
|
(0.704)
|
(0.225)
|
(0.761)
|
(0.460)
|
(0.282)
|
|
food
|
-1.402
|
-0.719
|
0.210
|
2.590
|
4.231
|
4.850
|
3.442
|
|
(0.451)
|
(0.718)
|
(0.930)
|
(0.117)
|
(0.019)
|
(0.005)
|
(0.056)
|
|
nonalc
|
-0.612
|
-2.586
|
-2.417
|
-0.793
|
0.886
|
2.662
|
2.688
|
|
(0.657)
|
(0.136)
|
(0.164)
|
(0.568)
|
(0.549)
|
(0.113)
|
(0.108)
|
|
alc
|
0.795
|
-0.825
|
-2.113
|
-2.496
|
-1.738
|
-1.836
|
-1.922
|
|
(0.695)
|
(0.690)
|
(0.258)
|
(0.216)
|
(0.404)
|
(0.343)
|
(0.315)
|
|
clothing*
|
8.225
|
5.901
|
3.294
|
3.419
|
2.121
|
4.385
|
7.374
|
|
(0.005)
|
(0.014)
|
(0.202)
|
(0.174)
|
(0.441)
|
(0.094)
|
(0.005)
|
|
housing
|
1.024
|
-0.102
|
-1.555
|
-4.839
|
-5.390
|
-4.619
|
-3.682
|
|
(0.878)
|
(0.911)
|
(0.648)
|
(0.225)
|
(0.207)
|
(0.225)
|
(0.286)
|
|
furn*
|
1.463
|
1.014
|
0.181
|
-1.211
|
0.699
|
1.165
|
2.154
|
|
(0.061)
|
(0.197)
|
(0.817)
|
(0.117)
|
(0.380)
|
(0.131)
|
(0.019)
|
|
health
|
2.561
|
2.029
|
1.754
|
1.802
|
3.153
|
5.098
|
5.287
|
|
(0.178)
|
(0.272)
|
(0.315)
|
(0.347)
|
(0.136)
|
(0.019)
|
(0.019)
|
|
transport
|
0.143
|
1.034
|
1.717
|
0.866
|
-0.112
|
1.376
|
2.172
|
|
(0.958)
|
(0.568)
|
(0.333)
|
(0.554)
|
(0.948)
|
(0.352)
|
(0.160)
|
|
commun
|
-2.028
|
-2.431
|
-2.058
|
-0.566
|
-0.586
|
-1.993
|
0.860
|
|
(0.239)
|
(0.169)
|
(0.258)
|
(0.700)
|
(0.695)
|
(0.263)
|
(0.592)
|
|
recr*
|
-0.802
|
-2.032
|
-3.410
|
-3.965
|
-4.310
|
-3.545
|
-0.533
|
|
(0.549)
|
(0.188)
|
(0.056)
|
(0.033)
|
(0.023)
|
(0.075)
|
(0.789)
|
|
educ
|
1.564
|
1.156
|
1.313
|
1.476
|
1.178
|
1.577
|
2.260
|
|
(0.319)
|
(0.451)
|
(0.390)
|
(0.366)
|
(0.446)
|
(0.324)
|
(0.188)
|
|
rest
|
4.222
|
3.531
|
4.176
|
5.265
|
6.417
|
8.837
|
6.821
|
|
(0.028)
|
(0.052)
|
(0.042)
|
(0.042)
|
(0.009)
|
(0.005)
|
(0.009)
|
|
misc
|
1.808
|
0.682
|
0.737
|
0.985
|
1.521
|
0.618
|
0.770
|
|
(0.099)
|
(0.455)
|
(0.418)
|
(0.300)
|
(0.127)
|
(0.488)
|
(0.413)
|
Note: Table entries are gaps between actual and synthetic values of corresponding variables. Positive gaps imply that actual values are greater than the synthetic ones. P-values are given in parentheses. Bold entries are significant at the 5% level. * Denotes specifications with no MSPEs three times larger than the Croatian one (leaving the baseline ASCM results intact). Source: Author’s calculation.
|
January
|
February
|
March
|
April
|
May
|
June
|
July
|
|
hicp
|
2.678
|
1.626
|
2.478
|
0.853
|
0.506
|
1.174
|
1.298
|
|
(0.355)
|
(0.595)
|
(0.397)
|
(0.769)
|
(0.81)
|
(0.636)
|
(0.554)
|
|
food
|
4.521
|
3.286
|
2.543
|
3.220
|
3.441
|
4.811
|
3.721
|
|
(0.157)
|
(0.306)
|
(0.372)
|
(0.215)
|
(0.149)
|
(0.025)
|
(0.074)
|
|
nonalc
|
1.124
|
-3.245
|
-3.583
|
-3.264
|
-2.031
|
0.215
|
-1.607
|
|
(0.736)
|
(0.339)
|
(0.413)
|
(0.463)
|
(0.62)
|
(0.95)
|
(0.463)
|
|
alc
|
2.783
|
1.040
|
-0.778
|
-0.455
|
-0.454
|
0.287
|
0.141
|
|
(0.215)
|
(0.579)
|
(0.678)
|
(0.851)
|
(0.843)
|
(0.959)
|
(0.992)
|
|
clothing
|
8.871
|
6.440
|
2.785
|
3.413
|
1.813
|
4.148
|
7.803
|
|
(0.008)
|
(0.033)
|
(0.421)
|
(0.174)
|
(0.636)
|
(0.083)
|
(0.008)
|
|
housing
|
-22.051
|
-16.597
|
-12.641
|
-27.614
|
-29.643
|
-20.988
|
-15.951
|
|
(0.612)
|
(0.562)
|
(0.653)
|
(0.388)
|
(0.372)
|
(0.397)
|
(0.512)
|
|
furn
|
6.726
|
5.535
|
4.894
|
3.677
|
3.762
|
3.114
|
3.022
|
|
(0.008)
|
(0.008)
|
(0.008)
|
(0.008)
|
(0.008)
|
(0.008)
|
(0.008)
|
|
health
|
-4.891
|
-5.445
|
-4.343
|
-5.334
|
-3.745
|
-1.526
|
-2.173
|
|
(0.099)
|
(0.066)
|
(0.165)
|
(0.215)
|
(0.355)
|
(0.711)
|
(0.57)
|
|
transport
|
-0.613
|
-0.533
|
-0.916
|
-0.845
|
-1.627
|
-0.587
|
0.558
|
|
(0.727)
|
(0.744)
|
(0.694)
|
(0.645)
|
(0.463)
|
(0.744)
|
(0.835)
|
|
commun
|
-0.076
|
-0.094
|
0.471
|
1.884
|
1.886
|
-0.362
|
3.159
|
|
(0.975)
|
(0.975)
|
(0.818)
|
(0.405)
|
(0.397)
|
(0.851)
|
(0.207)
|
|
recr
|
-6.616
|
-7.152
|
-8.661
|
-9.315
|
-8.989
|
-5.424
|
2.099
|
|
(0.231)
|
(0.165)
|
(0.14)
|
(0.058)
|
(0.033)
|
(0.149)
|
(0.545)
|
|
educ
|
13.190
|
13.044
|
13.313
|
12.737
|
12.811
|
13.079
|
13.782
|
|
(0.223)
|
(0.231)
|
(0.223)
|
(0.24)
|
(0.248)
|
(0.231)
|
(0.223)
|
|
rest
|
12.742
|
12.243
|
13.025
|
11.675
|
11.423
|
12.661
|
9.611
|
|
(0.033)
|
(0.033)
|
(0.033)
|
(0.033)
|
(0.025)
|
(0.017)
|
(0.025)
|
|
misc
|
3.894
|
2.993
|
2.967
|
2.476
|
2.331
|
1.888
|
1.904
|
|
(0.017)
|
(0.05)
|
(0.025)
|
(0.05)
|
(0.074)
|
(0.091)
|
(0.099)
|
Note: Table entries are gaps between actual and synthetic values of corresponding variables. Positive gaps imply that actual values are greater than the synthetic ones. P-values are given in parentheses. Bold entries are significant at the 5% level. Source: Author’s calculation.
|
January
|
February
|
March
|
April
|
May
|
June
|
July
|
|
hicp
|
3.285
|
2.245
|
2.821
|
1.683
|
2.210
|
3.117
|
2.998
|
|
(0.005)
|
(0.038)
|
(0.043)
|
(0.215)
|
(0.048)
|
(0.01)
|
(0.005)
|
|
food
|
1.832
|
1.994
|
2.338
|
4.398
|
4.890
|
5.469
|
3.203
|
|
(0.378)
|
(0.359)
|
(0.282)
|
(0.033)
|
(0.01)
|
(0.005)
|
(0.067)
|
|
nonalc
|
2.052
|
-0.339
|
0.642
|
2.290
|
3.811
|
4.546
|
3.525
|
|
(0.297)
|
(0.809)
|
(0.727)
|
(0.301)
|
(0.062)
|
(0.014)
|
(0.053)
|
|
alc
|
0.946
|
-0.674
|
-2.200
|
-1.948
|
-1.599
|
-1.388
|
-1.437
|
|
(0.627)
|
(0.756)
|
(0.278)
|
(0.321)
|
(0.459)
|
(0.536)
|
(0.512)
|
|
clothing
|
7.889
|
5.817
|
3.118
|
3.143
|
2.098
|
3.728
|
7.265
|
|
(0.005)
|
(0.019)
|
(0.187)
|
(0.158)
|
(0.373)
|
(0.091)
|
(0.005)
|
|
housing
|
5.608
|
4.200
|
1.014
|
-2.075
|
-2.172
|
-1.993
|
-0.969
|
|
(0.474)
|
(0.565)
|
(0.938)
|
(0.689)
|
(0.651)
|
(0.641)
|
(0.77)
|
|
furn
|
2.542
|
1.932
|
1.136
|
-0.299
|
1.425
|
1.600
|
2.469
|
|
(0.01)
|
(0.033)
|
(0.196)
|
(0.684)
|
(0.1)
|
(0.043)
|
(0.005)
|
|
health
|
2.516
|
1.926
|
1.670
|
1.929
|
2.990
|
4.239
|
4.506
|
|
(0.182)
|
(0.301)
|
(0.388)
|
(0.349)
|
(0.172)
|
(0.024)
|
(0.019)
|
|
transport
|
-0.216
|
-0.013
|
-0.837
|
-1.878
|
-1.846
|
-0.042
|
0.702
|
|
(0.809)
|
(0.952)
|
(0.574)
|
(0.244)
|
(0.263)
|
(0.947)
|
(0.651)
|
|
commun
|
-1.781
|
-1.922
|
-0.374
|
0.529
|
0.879
|
-0.322
|
2.579
|
|
(0.254)
|
(0.23)
|
(0.852)
|
(0.742)
|
(0.569)
|
(0.861)
|
(0.124)
|
|
recr
|
-1.670
|
-2.882
|
-4.296
|
-4.707
|
-4.951
|
-4.009
|
-0.692
|
|
(0.378)
|
(0.163)
|
(0.053)
|
(0.033)
|
(0.024)
|
(0.067)
|
(0.77)
|
|
educ
|
1.971
|
1.721
|
2.179
|
2.330
|
1.919
|
2.477
|
3.333
|
|
(0.603)
|
(0.636)
|
(0.569)
|
(0.541)
|
(0.612)
|
(0.522)
|
(0.397)
|
|
rest
|
7.230
|
6.572
|
7.063
|
7.692
|
9.500
|
11.415
|
9.530
|
|
(0.01)
|
(0.01)
|
(0.01)
|
(0.014)
|
(0.01)
|
(0.005)
|
(0.01)
|
|
misc
|
3.126
|
1.891
|
1.727
|
1.115
|
1.649
|
1.383
|
1.158
|
|
(0.01)
|
(0.11)
|
(0.11)
|
(0.268)
|
(0.1)
|
(0.201)
|
(0.273)
|
Note: Table entries are gaps between actual and synthetic values of corresponding variables. Positive gaps imply that actual values are greater than the synthetic ones. P-values are given in parentheses. Bold entries are significant at the 5% level. Source: Author’s calculation.
|
January
|
February
|
March
|
April
|
May
|
June
|
July
|
|
hicp
|
1.988
|
1.196
|
1.884
|
0.768
|
1.429
|
2.275
|
2.234
|
|
(0.024)
|
(0.212)
|
(0.108)
|
(0.472)
|
(0.189)
|
(0.028)
|
(0.005)
|
|
food
|
0.280
|
0.353
|
1.023
|
2.935
|
4.014
|
4.961
|
3.604
|
|
(0.901)
|
(0.882)
|
(0.559)
|
(0.113)
|
(0.024)
|
(0.005)
|
(0.028)
|
|
nonalc
|
-0.018
|
-2.062
|
-1.764
|
-0.213
|
1.533
|
2.949
|
2.625
|
|
(0.981)
|
(0.255)
|
(0.354)
|
(0.896)
|
(0.382)
|
(0.108)
|
(0.132)
|
|
alc
|
1.103
|
-0.491
|
-2.010
|
-1.754
|
-1.148
|
-1.276
|
-1.362
|
|
(0.571)
|
(0.844)
|
(0.288)
|
(0.368)
|
(0.509)
|
(0.552)
|
(0.524)
|
|
clothing
|
8.193
|
6.030
|
3.455
|
3.351
|
2.372
|
4.265
|
7.397
|
|
(0.005)
|
(0.009)
|
(0.16)
|
(0.156)
|
(0.349)
|
(0.08)
|
(0.005)
|
|
housing
|
4.264
|
3.606
|
0.971
|
-1.116
|
-1.014
|
-0.719
|
-0.274
|
|
(0.335)
|
(0.462)
|
(0.939)
|
(0.741)
|
(0.741)
|
(0.802)
|
(0.915)
|
|
furn
|
1.755
|
1.190
|
0.488
|
-0.790
|
0.936
|
1.357
|
2.262
|
|
(0.028)
|
(0.156)
|
(0.491)
|
(0.349)
|
(0.264)
|
(0.118)
|
(0.009)
|
|
health
|
2.431
|
1.840
|
1.588
|
1.836
|
2.889
|
4.155
|
4.422
|
|
(0.184)
|
(0.311)
|
(0.382)
|
(0.358)
|
(0.17)
|
(0.024)
|
(0.019)
|
|
transport
|
-0.822
|
-0.596
|
-1.142
|
-2.081
|
-1.851
|
-0.048
|
0.814
|
|
(0.566)
|
(0.632)
|
(0.472)
|
(0.217)
|
(0.259)
|
(0.892)
|
(0.608)
|
|
commun
|
-1.749
|
-1.682
|
-0.932
|
-0.004
|
0.254
|
-0.966
|
1.789
|
|
(0.269)
|
(0.311)
|
(0.604)
|
(1.000)
|
(0.868)
|
(0.594)
|
(0.269)
|
|
recr
|
-0.868
|
-2.090
|
-3.474
|
-4.006
|
-4.354
|
-3.561
|
-0.498
|
|
(0.528)
|
(0.203)
|
(0.057)
|
(0.033)
|
(0.024)
|
(0.075)
|
(0.811)
|
|
educ
|
1.980
|
1.726
|
2.335
|
2.504
|
2.130
|
2.737
|
3.618
|
|
(0.245)
|
(0.292)
|
(0.203)
|
(0.193)
|
(0.245)
|
(0.179)
|
(0.066)
|
|
rest
|
4.950
|
4.365
|
4.982
|
5.787
|
7.391
|
9.592
|
7.653
|
|
(0.024)
|
(0.033)
|
(0.028)
|
(0.028)
|
(0.009)
|
(0.005)
|
(0.009)
|
|
misc
|
1.963
|
0.501
|
0.695
|
0.594
|
1.495
|
1.238
|
1.218
|
|
(0.028)
|
(0.604)
|
(0.462)
|
(0.495)
|
(0.127)
|
(0.212)
|
(0.212)
|
Note: Table entries are gaps between actual and synthetic values of corresponding variables. Positive gaps imply that actual values are greater than the synthetic ones. P-values are given in parentheses. Bold entries are significant at the 5% level. Source: Author’s calculation.
|
January
|
February
|
March
|
April
|
May
|
June
|
July
|
|
meat
|
-1.283
|
-2.973
|
-0.734
|
2.335
|
0.091
|
0.432
|
-1.780
|
|
(0.521)
|
(0.178)
|
(0.770)
|
(0.362)
|
(0.986)
|
(0.915)
|
(0.484)
|
|
fish
|
-1.923
|
-3.275
|
-4.825
|
-5.100
|
-1.459
|
1.442
|
-0.095
|
|
(0.404)
|
(0.146)
|
(0.070)
|
(0.047)
|
(0.535)
|
(0.559)
|
(0.972)
|
|
milk
|
-2.491
|
-1.951
|
0.767
|
0.471
|
4.049
|
4.818
|
1.808
|
|
(0.352)
|
(0.507)
|
(0.803)
|
(0.854)
|
(0.164)
|
(0.117)
|
(0.432)
|
|
fruit
|
-4.303
|
-3.349
|
1.101
|
2.744
|
3.368
|
4.127
|
2.787
|
|
(0.277)
|
(0.380)
|
(0.779)
|
(0.455)
|
(0.366)
|
(0.296)
|
(0.455)
|
|
veg
|
-8.104
|
-4.751
|
2.806
|
3.644
|
4.121
|
7.153
|
7.649
|
|
(0.136)
|
(0.357)
|
(0.601)
|
(0.446)
|
(0.408)
|
(0.178)
|
(0.141)
|
|
coffee
|
-1.677
|
-1.464
|
-2.774
|
2.215
|
6.952
|
5.684
|
4.821
|
|
(0.371)
|
(0.441)
|
(0.211)
|
(0.329)
|
(0.014)
|
(0.014)
|
(0.023)
|
|
juice
|
0.157
|
-1.986
|
-0.516
|
-1.538
|
1.077
|
2.895
|
2.394
|
|
(0.901)
|
(0.441)
|
(0.831)
|
(0.592)
|
(0.685)
|
(0.244)
|
(0.300)
|
|
wine
|
-0.528
|
-0.290
|
0.727
|
2.099
|
5.995
|
3.565
|
5.966
|
|
(0.770)
|
(0.869)
|
(0.709)
|
(0.329)
|
(0.005)
|
(0.080)
|
(0.005)
|
|
beer
|
3.788
|
3.975
|
-0.751
|
-1.279
|
-0.452
|
0.967
|
3.097
|
|
(0.047)
|
(0.052)
|
(0.718)
|
(0.521)
|
(0.812)
|
(0.568)
|
(0.080)
|
|
tobacco
|
-0.927
|
-1.655
|
-2.002
|
-2.913
|
-2.302
|
-1.474
|
-3.132
|
|
(0.765)
|
(0.545)
|
(0.502)
|
(0.357)
|
(0.446)
|
(0.592)
|
(0.347)
|
|
cloth
|
8.285
|
6.095
|
3.391
|
3.044
|
1.403
|
3.844
|
6.031
|
|
(0.005)
|
(0.028)
|
(0.239)
|
(0.291)
|
(0.610)
|
(0.192)
|
(0.028)
|
|
foot
|
7.504
|
3.174
|
1.657
|
1.126
|
2.055
|
2.582
|
7.947
|
|
(0.014)
|
(0.310)
|
(0.582)
|
(0.681)
|
(0.512)
|
(0.385)
|
(0.009)
|
|
cater
|
4.486
|
3.314
|
3.236
|
4.180
|
4.397
|
5.376
|
5.883
|
|
(0.005)
|
(0.014)
|
(0.014)
|
(0.009)
|
(0.005)
|
(0.005)
|
(0.005)
|
|
rest_caf
|
5.289
|
3.131
|
3.325
|
4.224
|
4.380
|
5.399
|
5.818
|
|
(0.005)
|
(0.014)
|
(0.014)
|
(0.005)
|
(0.005)
|
(0.005)
|
(0.005)
|
|
accomm
|
2.670
|
4.605
|
4.833
|
-0.029
|
6.069
|
13.572
|
8.008
|
|
(0.399)
|
(0.150)
|
(0.131)
|
(0.977)
|
(0.066)
|
(0.014)
|
(0.033)
|
Note: Table entries are gaps between actual and synthetic values of corresponding variables. Positive gaps imply that actual values are greater than the synthetic ones. P-values are given in parentheses. Bold entries are significant at the 5% level. Source: Author’s’calculation.
Source: Author’s calculation.
Note: y-o-y annual HICP inflation rates are depicted on the horizontal axis, and measures of market concentration are on the vertical axis. Both panels refer to the period of 2006-2021, conditioned by data availability. Source: Author’s calculation based on data from the Agency for the Protection of Market Competition.
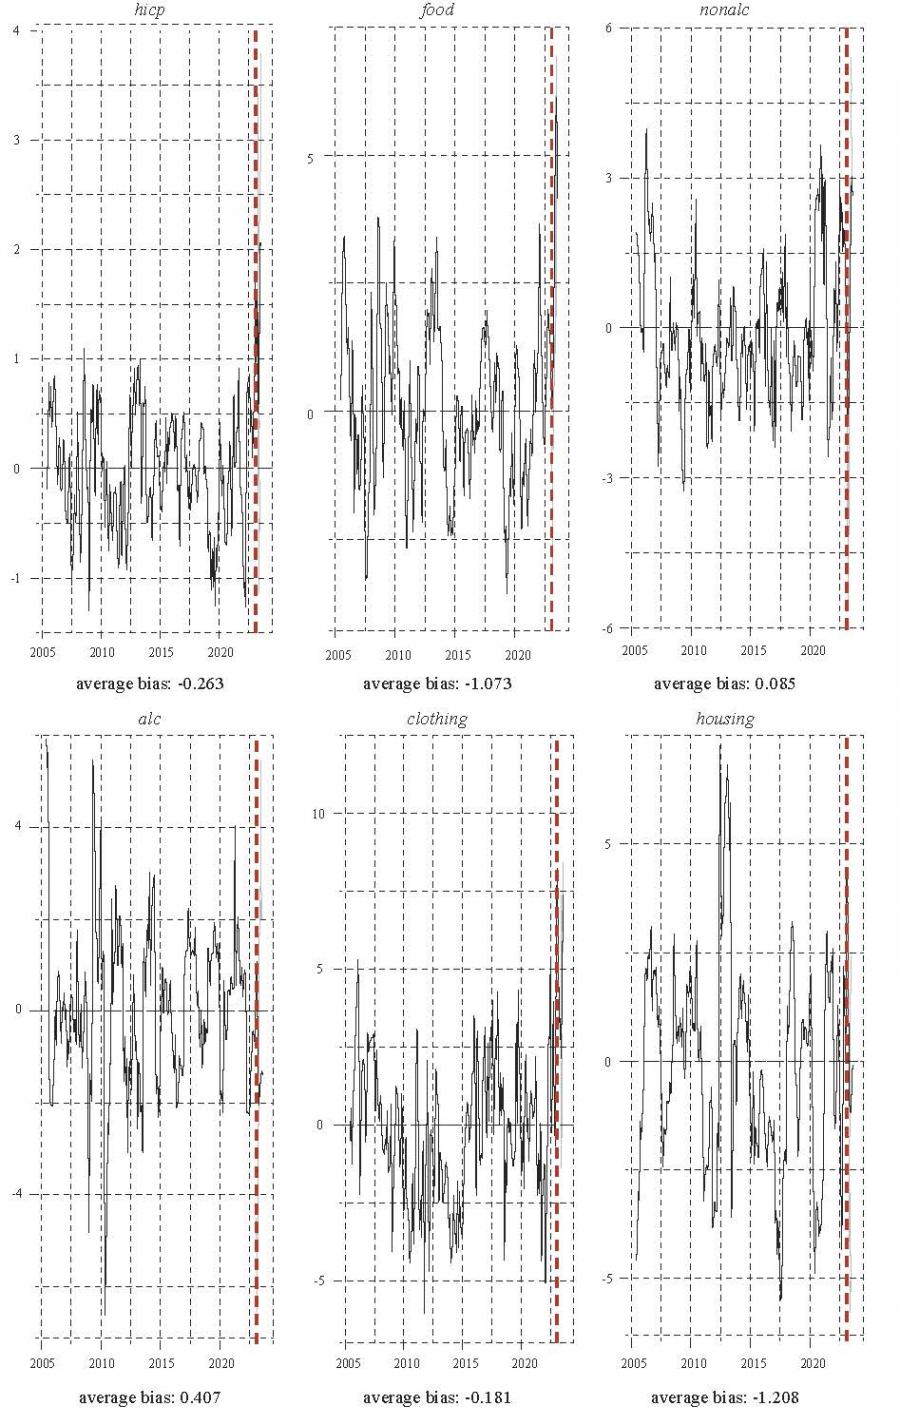 Note: Vertical axis captures the gaps between actual and synthetic values of corresponding variables (in percentage points). Positive gaps imply that actual values are greater than the synthetic ones, i.e. the currency changeover induced an inflation hike. Horizontal axis denotes time. Vertical dashed line denotes the date of currency changeover (January 2023). Grey shaded area after the currency changeover corresponds to the 95% confidence interval. Hicp and health models are estimated without auxiliary covariates. Food model is estimated with exp, gap, hicp, beer, fish, and milk as covariates. Nonalc, clothing, and housing models use exp, gap, and hicp as covariates. Furn and commun utilize fuel, exp, gap, and hicp; while recr, educ, rest, misc, and alc use fuel, exp, and gap as covariates. For the transport model we used exp and gap. Source: Author’s calculation.
Note: Vertical axis captures the gaps between actual and synthetic values of corresponding variables (in percentage points). Positive gaps imply that actual values are greater than the synthetic ones, i.e. the currency changeover induced an inflation hike. Horizontal axis denotes time. Vertical dashed line denotes the date of currency changeover (January 2023). Grey shaded area after the currency changeover corresponds to the 95% confidence interval. Meat, fish, fruit, veg, foot, rest_solo, and accomm models are estimated without auxiliary covariates. Wine and cloth models use exp, gap, and hicp as covariates. Milk, juice, beer, tobacco, and cater utilize fuel, exp, gap, and hicp as covariates. For the coffee model we used exp and gap. Source: Author’s calculation. 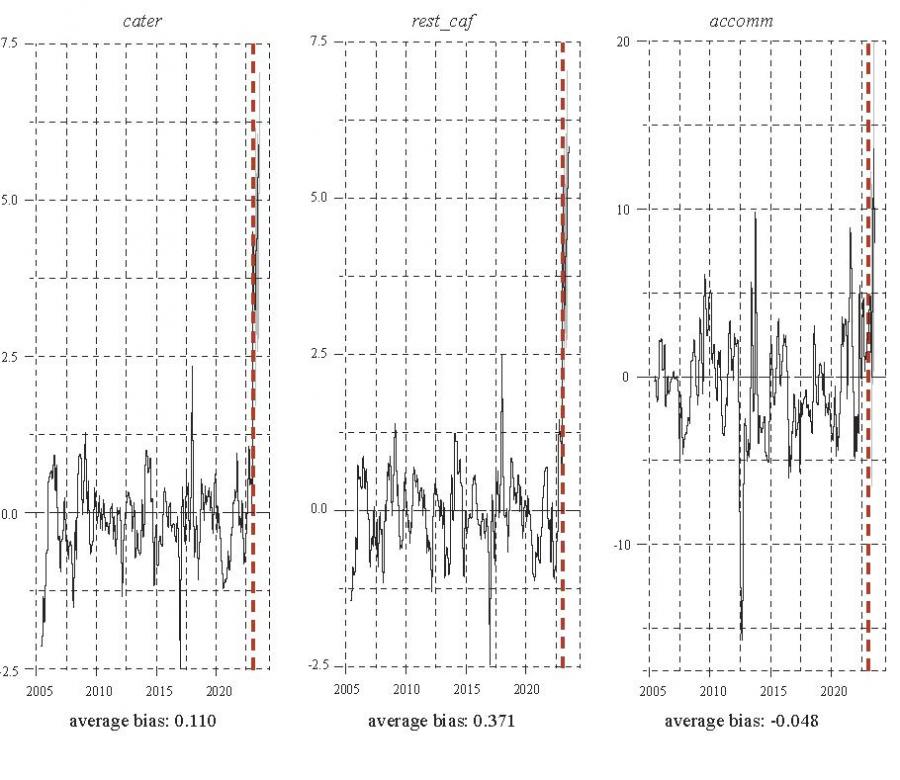 Note: Vertical axis captures the gaps between actual and synthetic values of corresponding variables (in percentage points). Positive gaps imply that actual values are greater than the synthetic ones, i.e. the currency changeover induced an inflation hike. Horizontal axis denotes time. Vertical dashed line denotes the date of currency changeover (January 2023). Grey shaded area after the currency changeover corresponds to the 95% confidence interval. Meat, fish, fruit, veg, foot, rest_solo, and accomm models are estimated without auxiliary covariates. Wine and cloth models use exp, gap, and hicp as covariates. Milk, juice, beer, tobacco, and cater utilize fuel, exp, gap, and hicp as covariates. For the coffee model we used exp and gap. Source: Author’s calculation.
|
January
|
February
|
March
|
April
|
May
|
June
|
July
|
|
hicp
|
1.048
|
0.434
|
0.847
|
0.000
|
0.702
|
1.652
|
1.823
|
|
(0.089)
|
(0.174)
|
(0.352)
|
(0.826)
|
(0.568)
|
(0.023)
|
(0.014)
|
|
food
|
-0.522
|
-0.716
|
-0.232
|
1.993
|
3.079
|
3.914
|
2.744
|
|
(0.413)
|
(0.423)
|
(0.793)
|
(0.775)
|
(0.460)
|
(0.249)
|
(0.709)
|
|
nonalc
|
-0.507
|
-2.834
|
-2.613
|
-1.084
|
1.189
|
2.076
|
2.150
|
|
(0.765)
|
(0.197)
|
(0.202)
|
(0.634)
|
(0.427)
|
(0.122)
|
(0.113)
|
|
alc
|
1.436
|
0.294
|
-1.040
|
-0.518
|
-0.103
|
0.553
|
0.109
|
|
(0.432)
|
(0.822)
|
(0.305)
|
(0.441)
|
(0.577)
|
(0.690)
|
(0.690)
|
|
clothing
|
6.406
|
4.039
|
1.820
|
1.070
|
0.093
|
1.796
|
4.496
|
|
(0.005)
|
(0.023)
|
(0.263)
|
(0.305)
|
(0.498)
|
(0.192)
|
(0.005)
|
|
housing
|
0.391
|
-0.587
|
-1.036
|
-5.251
|
-5.417
|
-4.636
|
-3.567
|
|
(0.117)
|
(0.146)
|
(0.362)
|
(0.789)
|
(0.704)
|
(0.606)
|
(0.573)
|
|
furn
|
1.784
|
1.233
|
0.046
|
-1.423
|
0.143
|
0.882
|
1.607
|
|
(0.028)
|
(0.174)
|
(0.521)
|
(0.324)
|
(0.615)
|
(0.282)
|
(0.033)
|
|
health
|
2.026
|
1.316
|
0.594
|
0.278
|
1.040
|
2.156
|
2.361
|
|
(0.502)
|
(0.728)
|
(0.728)
|
(0.573)
|
(0.329)
|
(0.197)
|
(0.192)
|
|
transport
|
-1.009
|
-0.596
|
-0.339
|
-1.726
|
-1.209
|
0.655
|
1.183
|
|
(0.761)
|
(0.488)
|
(0.840)
|
(0.596)
|
(0.643)
|
(0.488)
|
(0.315)
|
|
commun
|
0.368
|
-0.245
|
0.629
|
1.562
|
0.928
|
-0.252
|
1.924
|
|
(0.516)
|
(0.526)
|
(0.667)
|
(0.887)
|
(0.991)
|
(0.526)
|
(0.380)
|
|
recr
|
0.700
|
-0.570
|
-2.035
|
-2.597
|
-2.989
|
-2.664
|
-0.735
|
|
(0.967)
|
(0.338)
|
(0.146)
|
(0.056)
|
(0.047)
|
(0.033)
|
(0.085)
|
|
educ
|
0.353
|
-24.000
|
0.186
|
0.011
|
-0.190
|
0.395
|
1.052
|
|
(0.981)
|
(0.873)
|
(0.808)
|
(0.704)
|
(0.624)
|
(0.761)
|
(0.958)
|
|
rest
|
3.341
|
2.776
|
2.863
|
3.088
|
4.725
|
7.510
|
5.811
|
|
(0.028)
|
(0.033)
|
(0.028)
|
(0.042)
|
(0.014)
|
(0.005)
|
(0.005)
|
|
misc
|
1.042
|
-0.355
|
-0.237
|
-0.418
|
-0.380
|
-0.318
|
0.014
|
|
(0.028)
|
(0.695)
|
(0.376)
|
(0.254)
|
(0.164)
|
(0.047)
|
(0.038)
|
Note: Table entries are gaps between actual and synthetic values of corresponding variables. Positive gaps imply that actual values are greater than the synthetic ones. P-values are given in parentheses. Bold entries are significant at the 5% level. Source: Author’s calculation.
|
January
|
February
|
March
|
April
|
May
|
June
|
July
|
|
hicp
|
2.130
|
1.686
|
1.660
|
0.683
|
1.086
|
2.256
|
2.379
|
|
(0.089)
|
(0.174)
|
(0.352)
|
(0.826)
|
(0.568)
|
(0.023)
|
(0.014)
|
|
food
|
1.317
|
1.103
|
1.866
|
2.682
|
3.121
|
3.462
|
1.893
|
|
(0.413)
|
(0.423)
|
(0.793)
|
(0.775)
|
(0.46)
|
(0.249)
|
(0.709)
|
|
nonalc
|
1.229
|
-1.142
|
2.255
|
-0.191
|
1.816
|
2.812
|
1.673
|
|
(0.765)
|
(0.197)
|
(0.202)
|
(0.634)
|
(0.427)
|
(0.122)
|
(0.113)
|
|
alc
|
0.253
|
-1.483
|
-3.047
|
-2.157
|
-2.005
|
-1.661
|
-1.648
|
|
(0.432)
|
(0.822)
|
(0.305)
|
(0.441)
|
(0.577)
|
(0.69)
|
(0.69)
|
|
clothing
|
6.200
|
4.550
|
0.759
|
1.946
|
0.806
|
3.057
|
6.611
|
|
(0.005)
|
(0.023)
|
(0.263)
|
(0.305)
|
(0.498)
|
(0.192)
|
(0.005)
|
|
housing
|
6.506
|
5.691
|
2.228
|
0.138
|
0.341
|
0.600
|
-0.541
|
|
(0.117)
|
(0.146)
|
(0.362)
|
(0.789)
|
(0.704)
|
(0.606)
|
(0.573)
|
|
furn
|
-3.466
|
-3.012
|
-3.861
|
-4.883
|
-3.060
|
-1.630
|
-0.530
|
|
(0.028)
|
(0.174)
|
(0.521)
|
(0.324)
|
(0.615)
|
(0.282)
|
(0.033)
|
|
health
|
1.483
|
0.804
|
1.072
|
1.593
|
0.537
|
3.578
|
3.578
|
|
(0.502)
|
(0.728)
|
(0.728)
|
(0.573)
|
(0.329)
|
(0.197)
|
(0.192)
|
|
transport
|
1.844
|
1.932
|
-0.292
|
-1.231
|
-1.572
|
0.027
|
1.589
|
|
(0.761)
|
(0.488)
|
(0.84)
|
(0.596)
|
(0.643)
|
(0.488)
|
(0.315)
|
|
commun
|
-2.172
|
-1.698
|
-0.956
|
-0.133
|
-0.398
|
-1.550
|
1.175
|
|
(0.516)
|
(0.526)
|
(0.667)
|
(0.887)
|
(0.991)
|
(0.526)
|
(0.38)
|
|
recr
|
-3.983
|
-5.523
|
-7.025
|
-7.190
|
-6.930
|
-6.538
|
-4.478
|
|
(0.967)
|
(0.338)
|
(0.146)
|
(0.056)
|
(0.047)
|
(0.033)
|
(0.085)
|
|
educ
|
6.853
|
6.611
|
6.372
|
5.934
|
5.669
|
5.962
|
6.387
|
|
(0.981)
|
(0.873)
|
(0.808)
|
(0.704)
|
(0.624)
|
(0.761)
|
(0.958)
|
|
rest
|
2.290
|
1.822
|
2.142
|
2.303
|
4.345
|
7.273
|
5.867
|
|
(0.028)
|
(0.033)
|
(0.028)
|
(0.042)
|
(0.014)
|
(0.005)
|
(0.005)
|
|
misc
|
-1.425
|
-2.578
|
-2.593
|
-2.417
|
-2.143
|
-1.117
|
-0.310
|
|
(0.028)
|
(0.695)
|
(0.376)
|
(0.254)
|
(0.164)
|
(0.047)
|
(0.038)
|
Note: Table entries are gaps between actual and synthetic values of corresponding variables. Positive gaps imply that actual values are greater than the synthetic ones. P-values are given in parentheses. Bold entries are significant at the 5% level. Source: Author’s calculation.
|
January
|
February
|
March
|
April
|
May
|
June
|
July
|
|
hicp
|
0.851
|
0.634
|
1.218
|
-0.527
|
-0.425
|
0.459
|
0.948
|
|
food
|
-2.481
|
-1.535
|
-0.590
|
0.548
|
1.102
|
1.167
|
0.343
|
|
nonalc
|
0.218
|
-1.857
|
-1.481
|
-0.360
|
1.590
|
1.664
|
2.326
|
|
alc
|
2.164
|
-0.168
|
-1.283
|
-1.377
|
0.283
|
1.941
|
1.028
|
|
clothing
|
7.069
|
4.907
|
3.035
|
4.122
|
2.867
|
3.736
|
7.044
|
|
housing
|
-6.476
|
-4.073
|
-3.834
|
-9.746
|
-11.619
|
-10.590
|
-8.810
|
|
furnish
|
4.001
|
2.770
|
2.731
|
0.847
|
1.593
|
1.723
|
2.154
|
|
health
|
-0.227
|
-0.686
|
-0.945
|
-1.839
|
-0.615
|
-0.386
|
-0.062
|
|
transport
|
-1.400
|
-1.975
|
-1.969
|
-2.962
|
-4.194
|
-2.425
|
-0.019
|
|
commun
|
-2.808
|
-3.525
|
-3.162
|
-1.544
|
-0.892
|
-1.316
|
0.756
|
|
recr
|
3.000
|
1.630
|
0.586
|
-1.504
|
-1.260
|
-1.679
|
-2.002
|
|
educ
|
-5.692
|
-6.128
|
-6.146
|
-5.223
|
-5.587
|
-5.525
|
-5.425
|
|
rest
|
4.238
|
3.424
|
2.932
|
0.292
|
3.928
|
6.773
|
4.584
|
|
misc
|
2.999
|
1.364
|
2.649
|
3.161
|
3.476
|
2.990
|
3.050
|
Note: Table entries are gaps between actual and synthetic values of corresponding variables. Positive gaps imply that actual values are greater than the synthetic ones. P-values are given in parentheses. Bold entries are significant at the 5% level. Source: Author’s calculation.
|
|
|
Abstract
This paper aims to shed some light on the issue of euro-induced inflation in the case of the Croatian euro changeover. Applying the synthetic control method, we were unable to find unambiguous and robust evidence of such an impact on the aggregate level. Focusing on a wide array of products and services, we found no impact of the euro on most price subcategories except those related to food, clothes and restaurant prices. The findings for the latter two categories seem particularly robust, surviving a battery of alternative specifications such as the generalized synthetic control and matrix completion method. Placebo tests reveal considerable ambiguity vis-à-vis the exact timing of the euro effect on prices, probably reflecting the fact that Croatia had been a highly euroized economy years before the de iure changeover.
Keywords: Euro changeover; Euro area; Croatia; inflation; synthetic control method; causal inference
JEL: C54, E31, E52
1 Introduction
On January 1, 2023, Croatia officially entered the eurozone, becoming its 20th member state. Although the entire process of Croatian euro integration has been extensively debated through the prism of Optimum Currency Area theory (Deskar-Škrbić, Kotarac and Kunovac,  2020; Brkić and Šabić, 2018) as well as of the expected reduction in the cost of borrowing (Kunovac and Pavić, 2018), and the stimulus for international trade (Bukovšak, Ćudina and Pavić, 2018), the attention of the general public has been directed mainly to the potential inflationary effects of the euro changeover (Pufnik, 2018). 2020; Brkić and Šabić, 2018) as well as of the expected reduction in the cost of borrowing (Kunovac and Pavić, 2018), and the stimulus for international trade (Bukovšak, Ćudina and Pavić, 2018), the attention of the general public has been directed mainly to the potential inflationary effects of the euro changeover (Pufnik, 2018).
Unlike all previous euro area enlargements, the changeover in Croatia was managed in conditions of extreme inflationary pressures. The circumstances were highly conditioned by the prolonged and substantial quantitative easing by the FED and ECB after the global financial crisis, the recent disruption of supply chains, as well as a considerable base effect due to abrupt and stringent lockdown policies around the globe.
This type of setting has been particularly problematic in a country such as Croatia. Its past experiences with hyperinflation episodes have heavily determined the general framework of monetary policy, using the nominal HRK/EUR exchange rate as an anchor to stabilize inflation expectations. On the other hand, in recent months the Harmonized Index of Consumer Prices (HICP) inflation rate has spiked. Croatian consumers reacted to this shock by gradually increasing their inflation expectations to a historical maximum. This pattern is clearly visible in figure 1.
Figure 1HICP inflation (year-on-year) rates and inflation expectations in Croatia DISPLAY Figure
Ever since the stabilization program in October 1993, Croatian monetary authorities have successfully maintained price stability, so the newcoming double-digit inflation rate seemed a black swan event for Croatian consumers. They rightly noticed the correlation between these inflationary pressures and the timing of the Croatian euro changeover. For example, European Commission ( 2022) reports that, among the EU countries outside the euro area, Croatia had the highest share of citizens who were concerned about abusive price setting and malpractice during the euro changeover (81% of respondents fully or partially agreed with that claim). Likewise, the same percentage of Croatian citizens firmly believed that the euro would increase prices. However, does this correlation between an inflation spike and the timing of the euro introduction indeed imply causality? Did the euro changeover itself trigger abusive price setting and rounding effects?
Under the conditions of the just described inflationary pressures, it seems extremely complex to conduct a proper signal extraction study and quantify the exact extent to which the Croatian inflation can be attributed to other tendencies, and how much it is a direct consequence of euro-related factors such as menu costs, rounding of prices to increase retail profits, etc.
This paper provides an initial attempt to examine if there are direct causal effects of the 2023 euro changeover on inflation in Croatia. In doing so, we examine a wide set of 14 price categories to enable a granular perspective on the issue. Our results reveal than the euro conversion did not have a robustly significant effect on aggregate inflation. The same holds for most inflation subcategories considered, except for food, clothing and restaurant charges, which significantly increased at the beginning of the conversion.
The remainder of this paper is organized as follows. Section 2 reviews the well-established reasons for the common (mis)perception that previous euro changeovers acted as inflation triggers. Section 3 discusses data specificities and the methodological framework, while Section 4 presents the empirical results of the study. Finally, section 5 provides some policy implications and directions for future research.
2 Euro changeover as a potential inflation trigger
On the first day of 2002, euro coins and banknotes were introduced in 12 European countries with a total population of more than 300 million people. This was the largest-ever monetary changeover operation in the world (Stenkula, 2004). As such, it attracted wide attention from the general public, the media, and the academia. Although the official inflation rate in 2003 remained fairly stable, consumers’ perceptions of inflation were significantly upward-biased (Antonides, 2008). In subsequent years, there was a proliferation of empirical studies on the topic. Four major factors were shown to have led the consumers to overestimate the importance of euro changeover in driving the general price increase (see e.g. Sturm et al. (2009) for an excellent literature review). This section will briefly pinpoint the main empirical findings.
2.1 Media effect
At the outset of the 2002 euro changeover, the media started to build up public expectations vis-à-vis the inflationary effects of euro introduction. The general atmosphere could be best described through the German lens, and their extremely frequent usage of the word “Teuro”, a portmanteau term composed of “teur” (expensive) and the word “euro” (Lamla and Lein, 2015). And indeed, formal econometric studies identified a significant media effect on the accuracy of inflation expectations. Lamla and Lein (2014) found that negatively toned media reports about inflation (describing inflation as “bad”) triggered an upward bias of consumers’ inflation expectations.In the context of such media reports, an expectation was formed in the general public that retailers would seize the opportunity to unduly increase prices in order to boost their profit margins. Experimental evidence speaks in favor of such a selffulfilling prophecy (Traut-Mattausch et al., 2004; Greitemeyer et al., 2005), finding inflation expectations to be a significant driver of inflation perceptions and of the noticed gap between actual and perceived inflation rate.
Dräger ( 2014) also found a marginally significant media effect, establishing a causal chain from negatively toned media articles to inflation expectations, and then to actual inflation developments. Lamla and Lein ( 2015) similarly detected that agents’ inflationary perceptions were highly dependent on the news about rising inflation. Lamla and Lein ( 2015) clearly establish the euro introduction as a structural break in the observed relationship. The media effect is negligible before 2002, and highly significant afterwards.
2.2 Frequently bought goods hypothesis
Although the general price increase was not significantly influenced by euro introduction, some effects were noticed for frequently bought goods (Lunn and Duffy, 2015). Del Giovane and Sabbatini (2006) defined frequently bought goods as those purchased at least once a month: food, tobacco, everyday household products, newspapers, fuels, and services such as local transport, postal and banking services, restaurants and coffee shops, recreational and cultural services. The prices of these goods did indeed spike in 2002 (Del Giovane and Sabbatini, 2006; Lunn and Duffy, 2015). Some of these inflationary pressures were caused by menu charges, while in other cases retailers were seen to have rounded off their prices upwards. As a consequence, agents seem to have attached too large a weight to these categories of goods, producing largely and systematically biased perceptions of actual inflation rates.
This pattern is possibly a result of the availability heuristic (Kahneman and Tversky, 1979), meaning that agents systematically overweight the price changes of low-cost goods purchased on a frequent basis, often via out-of-pocket purchases (Del Giovane and Sabbatini, 2006; Dziuda and Mastrobuoni, 2009).
2.3 Methodological issues concerning inflation measurement
In euro area countries, inflation is measured via the Harmonised Index of Consumer Prices (HICP). A Laspeyres-type index, HICP is calculated by attaching consumption weights to individual item categories. However, these weights are updated rather infrequently, i.e. every five years (Antonides, 2008). Therefore, it comes as no particular surprise that the price indices of only a few item subcategories significantly explain the general consumers’ inflation perceptions. Nota bene, some of the most prominent frequently bought goods (such as food and drinks) are not among them.
2.4 Comparison effects
A study by Fessel GfK (2004) revealed that even two years after the introduction of euro, as many as 74% of Austrian consumers still mentally converted the euro prices to Austrian schillings. By fixing the reference prices to two years before, they inevitably neglected the secular tendency of price increases, and consequentially generated upwardly biased inflation perceptions.
Similar cognitive biases were noticed in the relationship between the consumers’ perceived inflation rate and the complexity of the conversion rates of their domestic currency vs. the euro. For example, the euro conversion rate of the German mark was 1.95583. Ehrmann ( 2006) suggests that German consumers used a simple rule of thumb when assessing euro prices after the conversion; they multiplied the displayed euro prices by two. This alone, ceteris paribus, induced an overestimation of 2.26%. More complex conversion rates, such as Austrian, Dutch, French, and Italian, triggered their consumers to err much more in their price comparisons.
After explaining the main driving forces of the euro-induced inflation perception gap, the following section will introduce our methodological approach to quantifying the euro effect on Croatian inflation.
3 Methodology and data
Previous studies of the relationship between euro changeover and inflation can mostly be divided into two methodological strands. The first one focuses on time series analysis such as Granger causality and cointegration tests on macroeconomic data (Antonides, 2008; Del Giovane and Sabbatini, 2009; Dziuda and Mastrobuoni, 2009; Dräger, 2014; Lamla and Lein, 2015). The other one is more concerned with micro experiments (Traut-Mattausch et al., 2004; Greitemeyer et al., 2005). Both approaches are perfectly plausible and add to our understanding of the phenomenon at hand. We aim to reconcile the two by offering a setup of a quasinatural experiment using macroeconomic data. In assessing the impact of a policy intervention or an exogeneous shock (such as a currency changeover) on social and economic outcomes, we follow the rationale of biomedical experiments to inspect whether the observed relationship between euro changeover and inflationary pressures can be attributed to pure correlation or causality. In this strand of research, after identifying the treatment sample, researchers should pay particular attention to the choice of proper control (comparison) sample. Ideally, the control units should be exactly the same as the treatment entities vis-à-vis a set of fundamentally important characteristics, but should not be exposed to the treatment of interest. In social sciences, units of analysis are often regions or countries, so appropriate comparison units frequently do not exist (George and Bennet, 2005; Abadie, Diamond and Hainmueller, 2015). In this particular case, Croatia stands out as an exemplar of sub-optimal efficiency of economic transition, a peculiar economic structure dominated by tourism-related activities, and étatism (Stojčić, 2012). Having that in mind, it seems extremely difficult to find proper comparison unit(s) for Croatia. To circumvent this kind of problem, Abadie and Gardeazabal (2003) and Abadie, Diamond and Hainmueller (2010; 2015) had introduced the Synthetic Control Method (SCM), a data-driven procedure aimed at constructing a counterfactual (synthetic control) as a weighted combination of potential comparison entities. Such synthetic control is conceptualized to exhibit the underlying characteristics of the treatment entity of interest better than any other single comparison unit. Within a very short period, SCM became an indispensable tool in many sciences, such as economics (Abadie, 2021; Campos, Coricelli and Moretti, 2019), health studies (Bouttell et al., 2018), sociology (Vagni and Breen, 2021), etc.
3.1 Synthetic control method
Being unable to observe a counterfactual Croatia that did not go through the euro changeover, we use the relevant macroeconomic data from all other EU economies. As the remaining 26 economies share the EU single market with Croatia and have a harmonized set of institutional rule and policy frameworks, they seem potentially plausible candidates for this purpose. Suppose that we observe a panel dataset consisting of J + 1 countries (j = 1, 2,..., J + 1), where the first country (j = 1) is the treated one. In our case, we are interested in the effect of an intervention (euro changeover) on Croatian inflation. Therefore, Croatia is the treated unit. The remaining EU economies (j = 2, 3, ..., 27) are not affected by the treatment, and as such comprise the donor pool, i.e. they are potential candidates for comparison. We observe a balanced panel, i.e. all units are observed across periods t = 1, 2,..., T. To be exact, our dataset spans from 2005M05 to 2023M07 (conditioned by data availability). As the intervention (euro changeover) occurred in January 2023, the time span consists of T0 = 212 monthly pre-treatment periods and T1 = 7 post-treatment monthly periods (T = T0 + T1 = 219).
The goal is to construct a synthetic control that resembles Croatia much more than any individual EU economy in terms of a selected set of variables. As the dependent (target) variables in the model, we use aggregate HICP inflation (hicp hereinafter), and its 13 subcomponents based on the European Classification of Individual Consumption according to Purpose (ECOICOP): food inflation (food hereinafter), inflation of non-acoholic beverages (nonalc), alcoholic beverages, tobacco and narcotics (alc), clothing and footwear (clothing), housing, water, electricity, gas and other fuels (housing), household equipment and routine household maintenance (furnish), health (health), transport (transport), communication (commun), recreation and culture (recr), education (educ), restaurants and hotels (rest), and miscellaneous goods and services (misc). We aim to estimate a separate synthetic control model for each of these 14 variables, constructing 14 different counterfactuals.
We use the following set of inflation covariates: output gap obtained by applying the Hodrick-Prescott filter on the industrial production index (2015=100) ( gap hereinafter), inflation expectations ( exp), and the HICP subcomponent related to the prices of electricity, gas, and other fuels ( fuel hereinafter). The first two variables are commonly found in various sorts of New-Keynesian Phillips curve specifications (e.g. Basistha and Nelson, 2007; Jašová, Moessner and Takáts, 2020; Panovska and Ramamurthy, 2022), while the latter variable proxies energy prices that are also widely accepted as an inflation driver. 1 The target inflation variables, along with energy prices, are expressed as year-on-year ( y-o-y) growth rates. For each of the 14 inflation categories we use gap, exp, and fuel as auxiliary covariates to construct a proper counterfactual.
Inflation expectations are derived from the EU Consumer Survey, in the form of a response balance (weighted difference between the shares of positive and negative answers) on the following survey question (see European Commission ( 2023) for details).
By comparison with the past 12 months, how do you expect that consumer prices will develop in the next 12 months? They will: a) increase more rapidly, b) increase at the same rate, c) increase at a slower rate, d) stay about the same, e) fall, f) don’t know.
Industrial production indices and all inflation data are obtained from Eurostat, while inflation expectations are made publicly available by the European Commission.
The stated predictors of inflation are conceptualized through a k × 1 vector of preintervention values for Croatia (denoted X1), and we introduce X0 as a k × J matrix comprising the same variable observations for other EU economies. Synthetic control is obtained as a weighted average of comparison units (Abadie and Gardeazabal, 2003; Abadie, Diamond and Hainmueller, 2010; 2015). The vector of weights W = (w2 ,w3 ... wJ+1)' comprises nonnegative elements (0 ≤ wj ≤1) for j = 2, 3,..., J + 1 and the weights sum up to 1 (w2 + w3 + ... + wJ+1 = 1). Optimal weights W* are determined as the value of W that minimizes the discrepancy between the pre-changeover characteristics of Croatia and its synthetic control: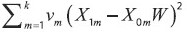 | (1) |
where X1m is the value of the m-th variable for Croatia, X0m is a 1 × J vector of m-th variable’s values for the comparison units, and vm is the non-negative weight (relative importance) attached to the m-th variable. The latter should take on large values for variables that closely correlate with the outcome variable for the treated entity.
Finally, estimating the causal effect of an intervention  comes down to comparing the post-changeover inflation in Croatia and the post-changeover inflation of its synthetic control: 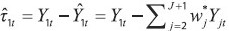 | (2) |
where Yjt is the outcome of entity j at time t, Y1 is a T1 × 1 vector of post intervention outcomes for the treated entity, and  is the SCM-estimated (synthetic) outcome without the treatment.
Although SCM is a powerful and widely applied tool for policy evaluations, it has its limitations. Most importantly, it does not allow formal econometric testing of the significance of the causal effect. To counteract that, we also use a relatively novel conformal inference method introduced by Ben-Michael, Feller and Rothstein ( 2021): Augmented Synthetic Control Method (ASCM).
In practice, it is often a very hard task to construct a proper counterfactual using SCM. ASCM is specifically designed to correct for the bias of SCM and improve the quality of the counterfactual. Ben-Michael, Feller and Rothstein ( 2021) conceptualized the ASCM framework as follows:  | (3) |
where  is the ASCM synthetic outcome (in this case counterfactual Croatian inflation rate, without the euro changeover), Xj is a vector or pre-changeover outcomes for the j-th EU economy, and X1 is a vector of pre-changeover outcomes of Croatia. This kind of notation is adopted to emphasize that pre-treatment outcomes are used as input (independent variables) in the model. In the same manner, Z1 and Zj are vectors of corresponding auxiliary covariates, while  and  are coefficients obtained through a ridge regression of the control post-treatment outcomes on centered pre-treatment outcomes, with a tuning parameter that penalizes the distance between ASCM weights and the conventional SCM weights. The idea of this estimator is to increase the pre-treatment fit of the classic SCM model (decrease its bias), while minimizing extrapolation from the convex hull (see BenMichael, Feller and Rothstein ( 2021) for details). It is important to highlight that ASCM weights wj*(as opposed to the standard SCM model (Abadie and Gardeazabal, 2003; Abadie, Diamond and Hainmueller, 2010; 2015)) are allowed to take negative values. Going back to our choice of the donor pool (26 remaining EU economies), it would be expected that ASCM attaches very small (or even negative) weights to core EU economies (e.g. Austria, Germany, France, etc.) whose economic sizes and structures do not positively and significantly correlate with the Croatian economy. Instead of handpicking the EU economies with economic structures similar to the Croatian (e.g. with a considerable share of tourism in GDP), we opted for letting the data speak for itself. Should those economies really comprise the optimal donor pool, ASCM would assign them the largest weights.
All estimations are performed in R Studio via packages Synth, augsynth, and MSCMT.
The reliability of ASCM results critically depends on the accuracy of its pre-treatment fit. Our estimates of a post-changeover euro effect on inflation are only as valid as our pre-changover estimate of synthetic counterfactual is similar to the actual Croatian inflation rate. For that purpose, we used the following approach. For the ASCM model with hicp as the dependent variable, we used fuel, exp, and gap as the potential pool of auxiliary covariates. We chose the combination that minimized the average pre-treatment bias (difference between actual and synthetic outcome). Average bias is a standard part of the estimation procedure in augsynth R package. For the remaining 13 inflation categories (food, nonalc, alc, clothing, housing, furnish, health, transport, commun, recr, educ, rest, and misc), we add hicp to the pool of auxiliary covariates, and again choose the combination that minimizes the average pre-treatment bias.
To inspect if the obtained ASCM results are robust enough, reaserchers usually resort to conducting placebo specifications across time and entities. A placebo test implies conducting the exact same analysis for a time period or cross-section unit where the expected effect of the intervention is equal to zero (non-rejection of the null hypothesis). In our case, a placebo test implies testing the effect of euro changeover in a country that has not actually undergone it, or testing its effect in a time period that cannot be related to the actual changeover. Observational studies often tend to under-report the results of placebo tests (so-called i nverse p-hacking) to corroborate their initial results (Dreber, Johannesson and Yifan, 2023). To address this issue properly, we conduct a series of placebo tests, extensively report their results and discuss them in detail.
3.2 Caveats
The end-point of the observed time span is conditioned by the latest available data at the moment of writing. One might question the appropriateness of SCM analysis for a dataset with T1 = 7 post-intervention periods. However, SCM is specifically designed to assess a smaller dataset (Gilchrist et al., 2023) compared to e.g. financial econometrics or machine learning techniques. Having that in mind, previous empirical SCM studies have routinely been conducted on smaller post-intervention sample sizes (e.g. Sills et al., 2015; Tkalec, Žilić and Recher, 2017; Gharehgozli, 2017). Likewise, we postulate that our SCM framework is also economically relevant because empirical studies of the 2002 euro changeover found that the impact of this monetary conversion on inflation (if any) was short-lived (Sturm et al., 2009; Pufnik, 2018).
Additionally, let us briefly discuss the utilization of y-o-y growth rates of all price variables. This step seemed very important in our empirical setting because it takes adequate account of any seasonal effects and working day adjustments, and it conceptually matches inflation expectations derived from consumer surveys (expected price development during the 12 months horizon). Finally, using growth rates of macroeconomic variables in SCM applications is rather standard (Opatrný, 2017; Boiciuc and Orțan, 2020).
4 Empirical results
We start by applying the ASCM framework to synthetize the counterfactual time series of Croatian inflation rate and test its (dis)similarity with the actual inflation rate after the euro changeover.Our baseline ASCM estimates are given in table 1 and figure A1 in the appendix. Our results seem to corroborate the finding from previous euro area enlargements that euro changeovers were specifically related to price increases of food (Brachinger, 2008; and Lunn and Duffy, 2015), clothing (Cavallo, Neiman and Rigobon, 2015; Rõõm and Urke, 2014), and restaurant services (Sturm et al., 2009; Pufnik, 2018). It should be noted that, aiming to shed additional light on these inflation categories and reduce bias as much as possible, we considered an additional set of auxiliary covariates. Inflation in food was (in addition to fuel, exp, gap, and hicp) modelled with lower-level inflation categories related to: meat ( meat), fish and seafood ( fish), milk, cheese and eggs ( milk), fruit ( fruit), vegetables ( veg), coffee, tea and cocoa ( coffee), wine ( wine), beer ( beer), tobacco ( tobacco). Clothing category is further augmented with its corresponding subcategories of inflation: clothing ( cloth) and footwear ( foot), while rest is modelled with the addition of catering services ( cater), restaurants, cafés and the like ( rest_caf), and accommodation services (a ccomm). Detailed specifications of all examined models are given in the note below figure A1.
Table 1ASCM baseline estimations (January to July 2023) DISPLAY Table
A glance at the results suggests that there is not much evidence of a euro effect on inflation. Aggregate HICP inflation reacted mildly in January, and then an intensification of the euro effect is again observed in June and July. Most of the considered subcategories did not react significantly. The only substantial and robust effect is observed for food, clothing, and rest. The reaction of food prices was not instantaneous, but characterized by a delay. It became significant only during the last three months of the sample, with a magnitude of 3.615 to 4.889%. As far as clothing prices are concerned, their difference between the actual and counterfactual Croatia is 8.225% in January, and then 5.901% in the following month. Restaurant prices seem to be roughly 4-9% higher due to the euro changeover, and the euro effect was much more persistent throughout the post-intervention period than was the case with other price categories.
The observed euro effect mostly intensifies in June and July (particularly for the rest category), which is probably related to the general concept of tourism-led inflation (Tkalec and Vizek, 2016).
ASCM chooses donor weights that optimize pre-treatment fit. For brevity, we do not report the full set of results, but provide only the average obtained country weights in figure 2. The highest weights are obtained for Spain (0.136), Slovakia (0.131), Malta (0.117), Portugal (0.0979), and Slovenia (0.090). These are either Mediterranean countries with comparable tourism-oriented economies, or Central and Eastern European post-transition countries that had similar historical, politico-economic and institutional trajectories as Croatia.
Figure 2Average ASCM country weights DISPLAY Figure
However, it remains to be seen whether this phenomenon is causally related or purely fortuitous. In that context, the literature suggests conducting placebo tests across entities and across time. For example, should similar results be observed for food, clothing and rest categories of other countries (that have not adopted the euro in January 2023), this would undermine the plausibility of the observed euroinduced inflation effect.
Table 2ASCM placebo specifications across countries (January to July 2023) DISPLAY Table
To shed some light on this issue, Abadie et al. (2010) and Abadie, Diamond and Hainmueller ( 2015) suggest augmenting the baseline model with additional estimates, i.e. repeating the analysis with J = 26 more iterations. In each of them, another country is set as the placebo intervention entity. The idea is to see if falsely setting any of the remaining 26 economies as intervention entities would generate better pre-treatment fit than the Croatian case with the actual euro conversion. As suggested by Abadie et al. (2010) and Abadie, Diamond and Hainmueller ( 2015), in each considered model, we calculate the mean squared prediction error (MSPE), and we identify countries with MSPEs several times higher than that the Croatian one. For these countries, our model was clearly not able to adequately reproduce the time dynamics of inflation prior to 2023.
As Abadie, Diamond and Hainmueller ( 2010: 502) state, placebo runs with poor fit prior to the intervention can hardly provide adequate information to measure the relative size of the shock after the intervention. In placebo tests across countries, we exclude all countries with MSPEs at least three times higher than the Croatian MSPE. As revealed by table 2, placebo tests across countries leave our previous conclusions mostly intact. The effect of euro introduction seems to be considerable only for food, clothing and rest. It should be noted that, this time, the effect of hicp is not significant at all (see table 1 vs. table 2).
The results of placebo tests across time are shown in tables 3-5. For placebo estimates we artificially set the intervention date before the actual timing of euro changeover. To be specific, we chose 2022M12 (one month before the actual changeover), 20022M09 (when the obligation of displaying dual prices (kuna vs. euro) was officially introduced in Croatia), and 2015M05 as the month when the Croatian y-o-y HICP inflation rate was zero. 2 This should serve as an adequate placebo test, especially having in mind that the euro conversion was introduced in circumstances of double-digit inflation rates.
Placebo specifications across time reveal a lot of ambiguity concerning the exact timing of the euro effect on prices. This does not come as such a surprise. Croatian integration to the euro area has been a long process, involving a more demanding procedure than previous countries entering the euro area. In June 2017, the Croatian Excessive Deficit Procedure was officially closed, so the Government could introduce the Euro adoption strategy in May 2018. After an intense bilateral cooperation with the ECB, the Croatian kuna was included in the ERM II mechanism in July 2020, and the EU Council finally made a positive decision regarding the Croatian euro adoption in July 2022. It should also be noted that Croatia is secularly characterized by deposit and credit euroization (Dumičić, Ljubaj and Martinis, 2018). Finally, Misztal ( 2017) found that Croatian inflation (both aggregate and related to individual ECOICOP subcategories) is a highly persistent phenomenon, so shocks should typically take a relatively long time to absorb. In that sense, any change that occurred due to the euro was certainly not an abrupt onetime intervention, but a gradual, possibly smooth transition process.
Table 3ASCM results (January to July 2023): placebo estimations across time (2015M05 as intervention date) DISPLAY Table Table 4ASCM results (January to July 2023): placebo estimations across time (2022M09 as intervention date) DISPLAY Table Table 5ASCM results (January to July 2023): placebo estimations across time (2022M12 as intervention date) DISPLAY Table
As a final robustness check, we utilize alternative ASCM estimators for constructing outcome weights. To be specific, we use SCM augmented with matrix completion (Athey et al., 2021), the generalized synthetic control methods (Xu, 2017) and the Becker and Klößner ( 2018) method. The results (see appendix) are again mostly very comparable to the baseline model (table 1), with the major exception that the euro effect on food is not significant. It should be noted that the Becker and Klößner ( 2018) method provides added value in terms of both accuracy and estimation speed. However, it does not allow for statistical inference in the manner we are interested in. Table A3 in the appendix illustrates that the gap between actual and synthetic inflation takes the largest (positive) value for clothing and rest, which is in line with our initial results. Although we are unable to test the statistical significance of these discrepancies, we might conclude that they corroborate our initial insights.
Further on, we also made an effort to model lower-level ECOICOP inflation subcomponents within the categories where we find rather robust evidence of a significant euro effect (food, clothing, and rest). This type of granular perspective might potentially enable us to obtain a deeper understanding of the economic mechanisms at hand. Here we again optimize the model fit by using a set of auxiliary covariates that minimize the average pre-treatment fit (fuel, exp, gap, and hicp are considered as potential covariates). The results are presented in table 6 and figure A2 in the appendix. The note below figure A2 specifies the exact set of covariates used for each inflation category.
Table 6 reveals that the prices of coffee, wine, clothing, footwear, catering, restaurants and cafés, and accommodation have indeed reacted the most intensively to the euro changeover. However, the average biases reported in figure A2 suggest that most of lower-level ECOICOP inferences are to be taken with caution since the obtained fit is largely questionable. The official EU statistics hardly provides decent auxiliary covariates that are able to capture the dynamics of inflation at such low level of aggregation.
Summarizing all the obtained evidence, it seems that the euro effect on inflation at the aggregate level is heavily dependent on the model specification and the underlying methodological framework. The majority of inflation subcategories do not offer evidence of a euro effect. The only three inflation categories that exhibit a substantial euro effect are food, clothing and rest. To grasp the magnitude of the observed effect on these constructs, we graphically depict the shares of price increases in 2023 attributable to euro changeover. As figure 3 shows, the observed impact is the most intensive for clothing in July 2023, where the euro accounts for 61.97% of y-o-y inflation. Namely, the official inflation rate for this category in January 2023 was 11.90%, and the euro effect accounts for a discrepancy of 7.37% between actual and counterfactual Croatia (see table 2). On average in the seven observed months, euro accounts for 46.14% of inflation in clothing, 32.72% of inflation in rest, and 15.72% of inflation in food. Very similar results are obtained for alternative ASCM estimators (appendix).
Table 6ASCM estimations for lower-level ECOICOP inflation categories (January to July 2023) DISPLAY Table Figure 3Price increases attributable to the euro changeover DISPLAY Figure
Although we are not aware of a study dealing with conversion-related inflation that uses the ASCM methodology, it is easy to notice that previous studies also found only a negligible fraction of inflation increase that can be attributed to the conversion. For example, Sturm et al. ( 2009) find the overall effect to be between 0.05 and 0.23 percentage points. Pufnik ( 2018) provides a very informative literature review on that topic, highlighting a series of papers with very similar findings that closely correlate to our finding that there was no dramatic effect on overall inflation. Likewise, recent policy reports and preliminary analyses have also noted a negligible effect of the currency changeover on Croatian inflation. According to the simulations of Falagiarda et al. ( 2023), Croatian inflation in January 2023 would have been only 0.4 percentage points lower without euro introduction (had the prices followed the dynamics of previous 10 years). Falagiarda et al. ( 2023) also perform an analysis of micro data, finding that the prices of as many as 65% of products have remained the same in January 2023 as in the previous month. That percentage was even higher (85%) in February in comparison to January.
The only three inflation constructs that exhibit a significant intervention effect are food, clothing and rest. All three constructs were also identified as conversion-related in previous euro area enlargements. For example, Brachinger ( 2008) and Lunn and Duffy ( 2015) identify frequently bought goods such as food as one of the main reasons for a euro-induced inflation perception gap in previous euro area enlargements.
Further on, Cavallo, Neiman and Rigobon ( 2015) find that web-shop clothing prices after the Latvian euro changeover rapidly converged to those of western European countries. Likewise, Rõõm and Urke ( 2014) find similar evidence for the Estonian case. On the other hand, previous studies uniformly identified restaurant prices as very susceptible to euro conversion shocks (see Sturm et al. ( 2009) and Pufnik ( 2018) for detailed comparisons of the estimated euro effects). These inferences can at least to some extent be explained by menu costs associated with the monetary conversion (Fabiani et al., 2007).
These results should also be interpreted with regard to the idiosyncracies of Croatian euro conversion. As opposed to previous enlargements, Croatia entered the euro area in a period of very high inflation rates. This is important for at least three reasons. Extreme values of inflation typically move economic agents away from rational expectations. Concepts such as bounded rationality and rational inattention are usually used to explain the consumers’ limited capacity to process volatile and frequently updated price information, which gives the sellers a short-run market power that may lead to price increases (Ehrmann, 2006). Second, extreme events such as the recent post-pandemic period usually induce biased inflation expectations (Sorić, Lolić and Matošec, 2020), which ultimately may feed into actual price increases. Third, the Croatian Government has responded to extreme inflationary pressures through a series of five anti-inflationary packages, administratively limiting the prices of basic foodstuffs, electricity and gas. This may be one of the reasons why a stronger euro effect was not found for food, as well as why the euro effect was mostly not significant for other ECOICOP categories (e.g. housing and transport). A glance at table 6 reveals that indeed the euro did not have much of an effect on food categories that (at least partially) had a price ceiling imposed by the Government (e.g. meat, milk, fruit, and veg).
Although the econometric framework of this study does not allow for a formal examination of the efficiency of obligatory dual pricing from September 2022 onward, this strategy has probably decreased the information processing requirements for consumers and made it easier to react to possible unfair price rounding. Previous studies of euro-related inflationary impact also postulated that euro area enlargements should lead to certain spillover effects of prices among member states. In that context, two theoretical concepts are particularly important. The first one is the law of one price (LOP), postulating that (under certain conditions) the prices of identical goods and services should be the same when expressed in the same currency. Glushenkova and Zachariadis ( 2016) noticed that the euro area is an ideal setup to test this theory, and found that LOP density functions indeed exhibit lower cross-country dispersion after the euro introduction.
The second one is price convergence among euro area member states. For example, Sturm et al. ( 2009) find that the euro introduction has indeed stimulated price convergence, the effect being much larger for non-tradable goods and services than for tradables.
When it comes to the underlying drivers of price convergence, Sturm et al. ( 2009) do not offer unambiguous evidence. Among the rare robust results is the finding that distance negatively affects price differentials. When explaining these inferences, Sturm et al. ( 2009: 221) question the appropriateness of macro data for this type of analysis. As micro data on prices would be a possibly more appropriate data source for testing both price convergence and the LOP, we leave this issue to future research.
If we were to identify a potential domestic culprit for the Croatian price hike around the currency changeover, it might be market concentration. The notion itself is not new. For example, Dziuda and Mastrobuoni ( 2009) find both anecdotal and rigorous econometric evidence that highly concentrated retail markets experienced more intensive euro-related inflation effects in the 2002 currency changeover. As expected, competition brings considerable benefits to consumers. To empirically question this claim for the Croatian case, we did some back-of-anenvelope calculations using two different measures of market concentration.
Figure 4Market concentration and inflation in Croatia DISPLAY Figure
As expected, figure 4 detects a rather strong negative correlation between market concentration and inflation. The assessed data is not restricted to the euro changeover period, and these scatter plots should not be interpreted as nothing more than correlations. Nevertheless, if we were to formulate policy implications from this analysis, they would certainly include market competition and ensuring effective antitrust regulations. In such circumstances, consumers have the opportunity to penalize price manipulations and malpractice of any kind by changing retailers without significant switching costs. Mužić and Pufnik ( 2022), as well as Falagiarda et al. ( 2023) also highlight competition as a key factor that should contribute to inflation stabilization after the euro conversion in Croatia.
5 Discussion and conclusion
This paper reveals that the euro changeover has had a modest impact on the overall inflation in Croatia. A disaggregated anaylsis reveals that very few categories of products and services (only food, clothing and restaurant prices) have indeed witnessed a substantial increase in the dawn of 2023 due to unfair pricing strategies, rounding effects, and retailers’ desire to generate extra profit.
Some attention should also be devoted to the political aspect of the changeover process. European Commission ( 2022) states that only 25% of Croatians feel that it is the right moment to adopt the common currency. The setting of already intensive inflationary pressures due to global circumstances added considerable noise to the communication channel and made it extremely difficult to monitor highfrequency price changes at all, let alone to identify euro-related price manipulations. As a consequence, the Government was not able to identify price manipulators among the retailers and could not blacklist them, as was originally planned (Government of the RC and CNB, 2020), and as was done by countries that have previously entered the euro area.
This paper does not even come close to resolving all issues related to the euroinflation nexus. We are confident that future studies will focus on an abundance of micro data on prices, which will possibly help in an understanding of the role and magnitude of price rounding amid the changeover, and deepen the understanding of price convergence and the validity of LOP. Further research on this topic should also focus on the phenomenon of inflation perceptions and its underlying determinants (media effects, the role of a priori expectations, socio-demographic factors, etc.). This would surely shed some light on the observed gap between actual and perceived inflation after the Croatian euro changeover.
Appendix
Figure A1ASCM baseline estimations DISPLAY Figure Figure A2ASCM estimations for lower-level ECOICOP inflation categories DISPLAY Figure Table A1ASCM robustness check via matrix completion method (January to July 2023) DISPLAY Table Table A2ASCM robustness check via generalized synthetic control (January to July 2023) DISPLAY Table Table A3ASCM robustness check via the Becker and Klößner (2018) method (January to July 2023) DISPLAY Table
Notes
* The author thanks the editor, Katarina Ott, and two anonymous reviewers for very useful and exceptionally meticulous comments that have considerably improved the quality of the paper. Any remaining errors are, of course, my own. The author also wants to thank Davor Jakelić (Agency for the Protection of Market Competition) and Jasminka Pecotić Kaufman for help with gathering retail market concentration data.
The article was judged the best regular article in the 2023 annual competition of the Prof. Dr. Marijan Hanžeković Trust.
1 Ideally, one would use oil prices on the global market as an exogenous inflation determinant (e.g. Wen, Zhang and Gong, 2021; Li and Guo, 2022), but SCM requires input data that vary across entities. As national HICP electricity, gas, and other fuels prices are closely positively correlated to the global market oil prices, we made an empirical compromise and continued the analysis with the former variable. In a similar vein, industrial production is used for the calculation of output gaps instead of GDP to ensure monthly frequencies of data.
2 We also considered the following placebo intervention dates: 2002M06, 2022M10, 2022M11, along with 2020M07 when Croatia entered the ERM2 mechanism and 2014M05 when the ECB released its first convergence report for Croatia (and declared that Croatia satisfies the Maastricht criterion of inflation stability). The results are qualitatively very similar to those reported in tables 3-5.
* The author thanks the editor, Katarina Ott, and two anonymous reviewers for very useful and exceptionally meticulous comments that have considerably improved the quality of the paper. Any remaining errors are, of course, my own. The author also wants to thank Davor Jakelić (Agency for the Protection of Market Competition) and Jasminka Pecotić Kaufman for help with gathering retail market concentration data. The article was judged the best regular article in the 2023 annual competition of the Prof. Dr. Marijan Hanžeković Trust.
1 Ideally, one would use oil prices on the global market as an exogenous inflation determinant (e.g. Wen, Zhang and Gong, 2021; Li and Guo, 2022), but SCM requires input data that vary across entities. As national HICP electricity, gas, and other fuels prices are closely positively correlated to the global market oil prices, we made an empirical compromise and continued the analysis with the former variable. In a similar vein, industrial production is used for the calculation of output gaps instead of GDP to ensure monthly frequencies of data.
2 We also considered the following placebo intervention dates: 2002M06, 2022M10, 2022M11, along with 2020M07 when Croatia entered the ERM2 mechanism and 2014M05 when the ECB released its first convergence report for Croatia (and declared that Croatia satisfies the Maastricht criterion of inflation stability). The results are qualitatively very similar to those reported in tables 3-5.
Disclosure statement
The author has no conflict of interest to declare.
References
Abadie, A. and Gardeazabal, J., 2003. The economic costs of conflict: A case study of the Basque county. American Economic Review, 93(1), pp. 112-132 [ CrossRef]
Abadie, A., 2021. Using synthetic controls: Feasibility. data requirements. and methodological aspects. Journal of Economic Literature, 59(2), pp. 391-425 [ CrossRef]
Abadie, A., Diamond, A. and Hainmueller, J., 2010. Synthetic control method for comparative case studies: Estimating the effect of California’s tobacco control program. Journal of the American Statistical Association, 105(490), pp. 493-505 [ CrossRef]
Abadie, A., Diamond, A. and Hainmueller, J., 2015. Comparative politics and the synthetic control method. American Journal of Political Science, 59(2), pp. 495-510 [ CrossRef]
Antonides, G., 2008. How is perceived inflation related to actual price changes in the European Union. Journal of Economic Psychology, 29(4), pp. 417-432 [ CrossRef]
Athey, S. [et al.], 2021. Matrix Completion Methods for Causal Panel Data Models. Journal of the American Statistical Association, 116(536), pp. 1716-1730 [ CrossRef]
Basistha, A. and Nelson, C. R., 2007. New measures of the output gap based on the forward-looking new Keynesian Phillips curve. Journal of Monetary Economics, 54(2), pp. 498-511 [ CrossRef]
Becker, M. and Klößner, S., 2018. Fast and realiable computation of genralized synthetic controls. Econometrics and Statistics, 5, pp. 1-19 [ CrossRef]
Ben-Michael, E., Feller, A. and Rothstein, J., 2021. The augmented synthetic control method. Journal of the American Statistical Association, 116(536), pp. 1789-1803 [ CrossRef]
Boiciuc, I. and Orțan, D., 2020. Estimating the effects of fiscal policy on GDP growth in Romania in 2015-2017 using the synthetic control method. Post-Communist Economies, 32(6), pp. 749-770 [ CrossRef]
Bouttell, J. [et al.], 2018. Synthetic control methodology as a tool for evaluating population-level health interventions. Journal of Epidemiology and Community Health, 72(8), pp. 673-678 [ CrossRef]
Brachinger, H. W., 2008. A new index of perceived inflation: Assumptions, method, and application to Germany. Journal of Economic Psychology, 29(49), pp. 433-457 [ CrossRef]
Brkić, M. and Šabić, A., 2018. Is the Euro the Optimum Currency for Croatia: An Assessment Using the Optimum Currency Area Theory. Privredna kretanja i ekonomska politika, 27(1), pp. 9-70 [ CrossRef]
Bukovšak, M., Ćudina, A. and Pavić, N., 2018. The Effects of Euro Adoption in Croatia on International Trade and Foreign Direct Investments. Privredna kretanja i ekonomska politika, 27(1), pp. 95-128 [ CrossRef]
Campos, N. F., Coricelli, F. and Moretti, L., 2019. Institutional integration and economic growth in Europe. Journal of Monetary Economics, 103, pp. 88-104 [ CrossRef]
Cavallo, A., Neiman, B. and Rigobon, R., 2015. The price impact of joining a currency union: Evidence from Latvia. IMF Economic Review, 63(2), pp. 281-297 [ CrossRef]
Del Giovane, P. and Sabbatini, R., 2008. Perceived and measured inflation after the launch of the euro: explaining the gap in Italy. In: P. Del Giovane and R. Sabbatini, eds. The Euro: Inflation and Consumer’s Perceptions. Springer. Berlin. Heidelberg [ CrossRef]
Deskar-Škrbić, M., Kotarac, K. and Kunovac, D., 2020. The third round of euro area enlargement: Are the candidates ready? Journal of International Money and Finance, 107, 102205 [ CrossRef]
Dräger, L., 2014. Inflation perceptions and expectations in Sweden – Are media reports the missing link? Oxford Bulletin of Economics and Statistics, 77(5), pp. 681-700 [ CrossRef]
Dreber, A., Johannesson, M. and Yifan, Y., 2023. Selective reporting of placebo tests in top economics journals. I4R Discussion Paper Series, No. 31 [ CrossRef]
Dumičić, M., Ljubaj, I. and Martinis, A., 2018. Persistence of euroization in Croatia. Surveys, S-31.
Dziuda, W. and Mastrobuoni, G., 2009. The Euro changeover and its effects on price transparency and inflation. Journal of Money, Credit and Banking, 41(1), pp. 101-129 [ CrossRef]
Ehrmann, M., 2006. Rational inattention. inflation developments and perceptions after the euro cash changeover. European Central Bank Working Paper Series, No. 588 [ CrossRef]
European Commission, 2022. Introduction of the euro area in the Member States that have not yet adopted the common currency. Flash Barometer, 508.
European Commission, 2023. The Joint Harmonised EU Programme of Business and Consumer Surveys. User Guide.
Fabiani, S. [et al.], 2007. Pricing decisions in the euro area: How firms set prices and why. New York: Oxford University Press [ CrossRef]
Fessel GfK, 2004. Euro. Täglicher Einkauf und gefühlte Inflation.
George, A. L. and Bennett, A., 2005. Case Studies and Theory Development in the Social Sciences. Cambridge MA: MIT Press.
Gharehgozli, O., 2017. An estimation of the economic costs of recent sanctions on Iran using the synthetic control method. Economics Letters, 157, pp. 141-144 [ CrossRef]
Gilchrist, D. [et al.], 2023. Synthetic Control Method: A tool for comparative case studies in economic history. Journal of Economics Surveys, 37(2), pp. 409-445 [ CrossRef]
Glushenkova, M. and Zachariadis, M., 2016. Understanding post-euro law-of-one-price deviations. Journal of Money, Credit and Banking, 48(6), pp. 1073-1111 [ CrossRef]
Greitemeyer, T. [et al.], 2005. The influence of price trend expectations on price trend perceptions: Why the Euro seems to make life more expensive? Journal of Economic Psychology, 26(4), pp. 541-548 [ CrossRef]
Jašová, M., Moessner, R. and Takáts, E., 2020. Dometics and global output gaps as inflation drivers: What does the Phillips curve tell? Economic Modelling, 87, pp. 238-253 [ CrossRef]
Kahneman, D. and Tversky, A., 1979. Prospect theory: an analysis of decision under risk. Econometrica, 47, pp. 263-291 [ CrossRef]
Kunovac, D. and Pavić, N., 2018. Can the Adoption of the Euro in Croatia Reduce the Cost of Borrowing? Privredna kretanja i ekonomska politika, 27(1), pp. 71-94 [ CrossRef]
Lamla, M. J. and Lein, S. M., 2014. The role of media for consumers’ inflation expectation formation. Journal of Economic Behavior & Organization, 106, pp. 62-77 [ CrossRef]
Lamla, M. J. and Lein, S. M., 2015. Information rigidities. inflation perceptions. and the media: Lessons from the euro cash changeover. Economic Inquiry, 53(1), pp. 9-22 [ CrossRef]
Li, Y. and Guo, J., 2022. The asymmetric impacts of oil price and shocks on inflation in BRICS: a multiple threshold nonlinear ARDL model. Applied Economics, 54(12), pp. 1377-1395 [ CrossRef]
Lunn, P. D. and Duffy, D., 2015. Perceptual noise and perceived inflation after the Euro currency changeover. Journal of Behavioral and Experimental Finance, 7, pp. 1-16 [ CrossRef]
Misztal, P., 2017. The investigation of inflation persistence in Croatia in the period of 2005-2013. Ekonomska istraživanja, 30(1), pp. 273-289 [ CrossRef]
Mužić, I. and Pufnik, A., 2022. Possible effects of the rounding of food product prices on inflation when adopting the euro. HNBlog, December 21, 2022.
Panovska, I. and Ramamurthy, S., 2022. Decomposing the output gap with inflation learning. Journal of Economic Dynamics and Control, 136, 104327 [ CrossRef]
Pufnik, A., 2018. Effects of the Adoption of the Euro on Consumer Prices and Inflation Perceptions: An Overview of Experiences and Assessment of the Possible Impact in Croatia. Privredna kretanja i ekonomska politika, 27(1), pp. 129-159 [ CrossRef]
Sills, E. O. [et al.], 2015. Estimating the Impacts of Local Policy Innovation: The Synthetic Control Method Applied to Tropical Deforestation. PLoS ONE 10(7), pp. e0132590 [ CrossRef]
Sorić, P., Lolić, I. and Matošec, M., 2020. Some properties of inflation expectations in the euro area. Metroeconomica, 71(1), pp. 176-203 [ CrossRef]
Stenkula, M., 2004. The Euro cash changeover process. Kyklos, 57(2), pp. 149-300 [ CrossRef]
Stojčić, N., 2012. Two decades of Croatian transition: A retrospective analysis. South East European Journal of Economics and Business,7(2), pp. 63-76 [ CrossRef]
Sturm, J. E. [et al.], 2009. The euro and prices: changeover-related inflation and price convergence in the euro area. Economic Papers, No. 381.
Tkalec, M. and Vizek, M., 2016. The price tag of tourism: Does tourism activity increase the prices of goods and services? T ourism Economics, 22(1), pp. 93-109 [ CrossRef]
Tkalec, M., Žilić, I. and Recher, V., 2017. The effect of film industry on tourism: Game of Thrones and Dubrovnik. International Journal of Tourism Research, 19(6), pp. 705-714 [ CrossRef]
Traut-Mattausch, E. [et al.], 2004. Expectancy confirmation in spite of disconfirming evidence: The case of price increases due to the introduction of the Euro. European Journal of Social Psychology, 34(6), pp. 739-760 [ CrossRef]
Vagni, G. and Breen, R., 2021. Earnings and income penalties for motherhood: Estimates for British women using the individual synthetic control method. European Sociological Review, 37(5), pp. 843-848 [ CrossRef]
Wen, F., Zhang, K. and Gong, X., 2021. The effects of oil prices shocks on inflation in the G7 countries. The North American Journal of Economics and Finance, 57, pp. 101391 [ CrossRef]
Xu, Y., 2017. Generalized Synthetic Control Method: Causal Inference with Interactive Fixed Effects Models. Political Analysis, 25(1), pp. 57-76 [ CrossRef]
|
|
|
March, 2024
I/2024
|


