|
|
|
Abstract
This paper provides a first assessment of the fiscal and distributional consequences of the ongoing structural changes in the labour markets of EU member states, mostly driven by technological progress and ageing. The Cedefop 2020 Skills forecast (including the effects of COVID-19), population projections and the forecast on pension expenditures depict a scenario of an ageing population, an inverted U-shaped unemployment trend and potentially polarising labour markets in the EU till 2030, the latter mostly driven by a surge in high-skill occupations. We make use of the microsimulation model EUROMOD and reweighting techniques to analyse the fiscal and distributional impacts of these trends under a no-policy-change assumption. The results suggest that the macro trends will increase pressure on government budgets, however, we also show that the current tax-benefit systems have the capacity to counterbalance the increases in income inequality and poverty risks triggered by the expected future labour markets developments.
Keywords: income distribution; budget; deficit; job polarisation; population ageing; COVID-19
JEL: J11, J21, H68
1 Introduction
Ongoing changes in labour markets could pose a challenge for tax-benefit systems of EU member states and therefore affect their role with respect to social cohesion. Long-term trends, such as technological progress and ageing, are likely to affect the structure of the labour markets in terms of skills demanded and supplied, earnings distribution and sustainability of welfare systems, including pensions.
During the past decade, various studies have shown that the share of employment in occupations in the middle of the skill distribution have declined rapidly, in both the US and Europe. At the same time, the employment share at the upper and lower ends of the occupational skill distribution has increased substantially (Autor, Katz and Kearneyt,  2006 2006; Goos and Manning, 2007; Goos, Manning and Salomons, 2009; David and Dorn, 2013). As a reason for the trend of increasing skills polarisation, the literature has pointed out that middle-skill jobs often consist of routine tasks that are relatively easy to automatize. There is thus a declining demand for middle-skill jobs (see, among others, Autor, Levy and Murnane, 2003; Michaels, Natraj and Van Reenen, 2014; European Commission, 2018).
Cedefop and Eurofound ( 2018) describe long-term trends in job polarisation in Europe. These projections suggest that while from a European perspective the hypothesis of increasing job polarisation seems likely, this does not hold for all EU member states. Together with population ageing, these trends can have a substantial influence not only on labour markets, but also on tax revenues, inequality, income distribution and overall on social cohesion. Any emergence of tight labour markets (i.e. labour markets in which there are shortages) in EU member states in the near future, especially for high- and low-skilled workers (Cedefop, 2021), may push their wages up. This may have pronounced effects on tax revenues and inequality among workers across different skill levels (including increased wage differences). In addition, ageing and polarisation could pose a challenge to poverty and inequality reduction, as well as to the shock absorption capacity of existing tax-benefit systems (Dolls et al., 2017; 2019).
To summarize, both megatrends – technological progress and population ageing – directly affect economic growth and social and economic inequality. As argued by Acemoglu and Restrepo ( 2017), rapidly ageing societies in the past have grown faster, mainly because of a more rapid adoption of automation technologies. However, these automation technologies might directly impact income inequality (see Prettner and Stroulik, 2020). Additionally, automation could put numbers of jobs at risk (Frey and Osborne, 2017) and might lead to further job polarization (Goos, Manning and Salomons, 2014), directly affecting social and economic inequality and may raise concerns about social cohesion. This paper provides an assessment of the fiscal and distributional consequences of changing labour markets due mega trends, such as technological progress and population ageing, in EU member states till 2030 under a no policy-change assumption. Additionally, to the best of our knowledge we are the first to try to account for the impact of the COVID-19 pandemic on these megatrends. We make use of reweighting and microsimulation techniques to change the statistical weights of individuals in the EU-SILC survey dataset used in the static microsimulation model EUROMOD. The change of weights is done in such a way that the new data mimic the projected population’s age distribution and skill composition in the long-term. The specific scenario we consider derives from available labour market, population and pension expenditure projections. We use data from a dedicated Cedefop Skills forecast scenario that assesses the long-term impact of COVID-19 on the labour market. Additionally, we use EUROSTAT population statistics as well as the pension expenditure forecasts of the 2021 EU Ageing Report 1 to account for the socio-demographic developments for the years 2019, 2025 and 2030. These projections are used to reweigh EUROMOD underlying data, which are based on the 2017 European Statistics on Income and Living Conditions (EU-SILC, with income reference year 2016).
Our work also contributes to the rapidly increasing literature on the economic impact of the COVID-19 pandemic. As argued by Autor and Reynolds ( 2020) the COVID-19 crisis might incentivize firms to automate tasks more rapidly (automation forcing). 2 Similar in spirit to the approach used in our work, the paper of Aziz, Ball and Creedy ( 2015) uses demographic projections combined with a reweighting approach to analyse the effect of ageing on the income distribution in New Zealand. The authors find evidence of an increase in market income inequality but stable disposable income inequality due to the balancing effects of the tax-benefit system. Dolls et al. ( 2019), analyse the effect of population ageing and increasing educational attainment in the EU. Combining a reweighting approach with wage responses, the authors show that while population ageing potentially increases income inequality, its impact on wages will potentially offset this effect. Our work differs from Dolls et al. ( 2019) in that we explicitly take account of changes in the skill composition 3.
The paper is organised as follows. Section 2 describes the socio-economic data and methodology and also shows the underlying labour market, pension expenditure and population trends expected for the next decade. Section 3 discusses the impact of these trends on the government budgets of the EU-27, as well as on inequality and poverty measures. Section 4 then concludes.
2 Data and methods
We use EUROMOD, the microsimulation model for the European Union (Sutherland and Figar, 2013). We combine EUROMOD with a reweighting approach to adjust the micro data EUROMOD uses to projections from Cedefop’s Skills forecast, EUROSTAT’s population projection and the pension expenditure projections from the 2021 Ageing Report (Economic Policy Committee, 2020). Our aim is to evaluate fiscal and distributional consequences of structural changes in the labour markets in the medium-term. The analysis incorporates the consequences of the COVID-19 pandemic on both the labour market and pension expenditure.
2.1 EUROMOD
EUROMOD is a microsimulation model covering all the EU member states4. The model analyses in a consistent and cross-country comparable manner the role played by tax-benefit instruments in the formation of household’s disposable income. The simulations presented here are based on EUROMOD version I2.0+ using EU-SILC (European Union Statistics on Income and Living Conditions) 2017 data (income reference period is 2016)5. EU-SILC data collect information on the demographic and economic circumstances of a representative sample of individuals and households in each EU member state. EUROMOD employs these to simulate direct tax liabilities and (non-contributory) benefit entitlements for a representative sample of households6. The simulations run on the tax-benefit rules as of 30 June 2019. It is important to recall first, that EUROMOD covers only the household side of the economy. Second, our simulations do not incorporate second-round and behavioural effects. This means that potential equilibrium effects of changes in the labour markets are not taken into account.
2.2 EUROSTAT population projections
The population projections by EUROSTAT provide estimates of future changes in the size and structure of the EU member states’ populations. To produce the projections, EUROSTAT assumes increasing fertility rates, decreasing mortality rates and positive net migration in most countries in their baseline scenario (EUROPOP2019). For this study, we use the forecast data up to 2030 for a population in the age groups of 0-15 years, 16-40, 41-65 and 65+. No changes were made to the baseline population projections as a result of the COVID-19 pandemic.
Population projections data, summarized in table A1 in the appendix, show that the total EU-27 population will increase by 3 million between 2019 and 2030, when it will reach 449 million. Sixteen member states will experience an increase in the total population between 2019 and 2030, while 11 (Bulgaria, Croatia, Greece, Hungary, Italy, Lithuania, Latvia, Poland, Portugal, Romania and Slovakia) will experience a population reduction. In relative terms, Latvia will experience the largest reduction in the overall population (-11%), and Malta the largest increase (+19%).
Figure 1Population projections by age groups in the EU-27, 2019-2030 DISPLAY Figure
The projections also highlight that EU countries are expected to face population ageing in the coming decade, as highlighted in figure 1 for the EU as a whole. The number of over-65s will increase by 21% at the EU level by 2030, when this population subgroup will account for 22.8% of the total EU population.
However, ageing will affect EU countries differently (see figure A1 in the appendix), with Ireland and Luxembourg experiencing an increase in the number of over-65s close to 40%. Bulgaria will experience the smallest increase in the number of those over 65. In terms of population share, Italy is expected to have the highest share of over-65s by 2030 (25.1%, +3.7 p.p. compared to 2019); Ireland the smallest share (16%).
2.3 Cedefop skills forecast
The core element of our approach to study the role of tax-benefit systems in view of future labour markets trends is the Cedefop Skills forecast (Cedefop, 2021).7 It includes information on EU member states’ current structure of occupations on the labour market and provides medium-term projections for skills' demand and supply, following changes in that structure. This analysis makes use of Cedefop Skills forecast data for the years 2019, 2025 to 2030. The scenario employed for the projection builds on data from a dedicated Cedefop Skills forecast scenario that investigates the impact the COVID-19 pandemic may have on medium-term skills' demand and supply. However, the analysis does not focus on the year 2020. This is because the extraordinary use of short-term work schemes and other discretionary policy measures widely used at the onset of the pandemic, cannot be captured appropriately by the reweighting procedure, and therefore results for 2020 would not be robust enough.
Cedefop’s Skills forecast uses a modular approach, with specific modules for the demand for skills by sector of economic activity and occupations. The supply of skills (per level of educational attainment) is projected independently from the demand module. 8 The forecast is mainly built on data from EUROSTAT, national accounts and the EU labour force survey (LFS). The COVID-19 scenario built by Cedefop is based on statistical data available at the time of the modelling exercise (in most cases it includes data releases for the second quarter of 2020 from EUROSTAT and other national statistics). It also benefits from comments from country experts composing Cedefop’s Skills forecast network. The assumptions reflected two lockdown waves and assumed that a vaccine would be available by mid-2021. The general assumptions are discussed in the appendix in more detail.
The forecasts produce mainly employment estimates, i.e., the number of employed workers in different sectors, occupations and countries. Occupations requiring high skills are considered those in ISCO 1-3. Medium-skilled occupations are considered those in ISCO 4-8, and low-skilled those in ISCO 9.
In Cedefop’s projections, unemployment is not a direct product of the macroeconomic model but it is the residual between employment (labour demand) and the labour force (labour supply). Cedefop’s Skills forecast network reviews the projections of both employment and the labour force. Following their recommendations, adjustments may be made, possibly affecting the levels of projected unemployment. In that context, it is important to know that Cedefop’s estimates of employment refer to jobs rather than persons as it uses National Accounts data which offer a more complete picture of employment activity in a country than the Labour Force Survey. However, as the labour force counts persons, the approach tends to underestimate unemployment. In a second step, Cedefop employs historical data on LFS unemployment to adjust the unemployment estimates. Nevertheless, the process implies that employment and unemployment in the Skills forecast data will not be necessarily equal to the labour force.
Looking at the Covid-19 pandemic, this has caused job opportunities to collapse towards zero during the initial decline of economic activity and employment. In subsequent years, once the immediate crisis subsides as expected, employment growth will recover, to some extent, leading to stronger job opportunities (due to a bounce-back effect) than were originally forecast. Over the whole forecast period (and not just the period of recovery after the initial negative impact), however, job opportunities are expected to remain below the level of the pre-Covid forecast. The Covid-19 pandemic, though presumed to be only of a transitory nature, will have lasting effects on job opportunities and thus employment over the entire forecast period.
As highlighted in figure 2, the Cedefop Skills forecast shows that the EU level unemployment rate is expected to increase in the post COVID-19 years. In 2025, the EU-wide unemployment rate is expected to be about 8.3% of the labour force, thus 1.5 p.p. higher than in 2019. However, after 2025 the unemployment rate is expected to fall to below the pre-COVID-19 level. Employment rates, defined as the number of jobs divided by the number of people of working-age (15-64), show an upward trend from about 71% to 75%, most of the increase happening after 2025. The projections for EU member states can be seen in figure A2 in the appendix.
Figure 2Employment and unemployment projections in the EU-27, 2019-2030 DISPLAY Figure
Both findings are mainly due to the decline of the working-age population, while the total number of jobs in the EU is forecast to stay stable over the 2019-2030 period (table A2 in the appendix). It is worth noting that the Cedefop forecast expects a substantial increase in labour market participation of people above 65.
As highlighted in figure 3, the number of high-skill jobs in the EU will rise by about 10% in the period 2019-2030. At the same time, the number of low-skill jobs is expected to increase by about 2% and the number of medium-skill jobs to fall by almost 4%. In terms of job shares, high-skill jobs will account for 43.4% of the total jobs in 2030, up from 40.5% in 2019. Medium-skill jobs will account for 47% (close to 50% in 2019), while 9.6% of the jobs will be low-skilled (9.7% in 2019) (table A2 in the appendix). The data hence show that despite their increase in number, the share of low-skill jobs in the EU will remain stable.
Figure 3Skills forecast projections in the EU-27, 2019-2030 DISPLAY Figure
In terms of skill composition, figure 4 shows that three general patterns can be identified across EU member states. In most countries, high-skill jobs will experience the highest (or least negative) growth rate, followed by low-skill jobs and medium-skill jobs. In Austria, Finland, France and Slovenia low-skill jobs will grow the most, followed by high-skill jobs and medium-skill jobs. In eight countries – Czechia, Spain, Italy, Latvia, Lithuania, Luxembourg Malta and Sweden – high-skill jobs will grow the most, followed by medium-skill and low-skill jobs. It should be noted that the number of high-skill jobs is expected to increase in all member states, with the exception of Bulgaria. The exception can be explained with the fall in the total number of jobs (and employment rates) forecasted for this country. About half of the EU member states will experience a reduction in the absolute number of medium-skill jobs. Seven member states will experience a reduction in the number of low-skill jobs (see table A2 in the appendix for the share of each skill group out of the total jobs) 9.
Figure 4Skill evolution index across EU member states, 2019-2030 (2019 = 100) DISPLAY Figure
The evidence described suggests the existence of a job polarisation trend in the EU labour market, with larger increases in the number of high- and low-skill jobs compared with medium-skill occupations in all but eight countries. The growth in high-skill occupations tends to be more pronounced than is the case for low-skill occupations in most countries. Recent analysis sees job polarization being driven by rapid job growth at the bottom of the wage distribution (Cedefop and Eurofound, ( 2018), together with a drop in medium-skill physical or routine tasks (largely replaced by automation and technological changes), while social and intellectual high-skill tasks become more prevalent.
2.4 Pension expenditure projections
Data on pension expenditure are based on the 2021 Ageing Report.10 The data used refer to a scenario that takes into account the impact of the COVID-19 pandemic. Please note that the 2021 Ageing Report assumes the implementation of already legislated reforms (as per 2020), but no future reforms. This enables us to highlight the change in age-related expenditures if current policies remain unchanged.
Pension expenditure is expected to increase in most of the EU-27 member states. Figure 5 highlights the pension expenditure in percent of GDP in 2019, 2025 and 2030. Only a few member states, such as Denmark, Estonia, Greece, Latvia, Malta and Sweden are expected to have stable or decreasing pension expenditure.
Figure 5Pension expenditure projections across EU member states, 2019-2030 (% of GDP) DISPLAY Figure
2.5 The empirical approach
The Cedefop Skills forecasts, together with the EUROSTAT population projections (EUROPOP2019) and the pension expenditure forecast of the 2021 Ageing Report allow some inferences about the challenges that the EU tax-benefit systems will face in the medium term because of changing labour markets.
The empirical approach followed in this paper is based on reweighting, i.e. introducing changes in the population structure in the underlying survey data (in our case the EU-SILC data) such that the micro data mirror the expected macro trends. This methodology is often used to “nowcast” the survey data 11 (see, e.g., Leulescu et al., 2016), but also to estimate potential impacts of future changes in socioeconomic characteristics of the population (see, e.g., Dolls et al., 2019). We analyse the impact of future changes in the labour market (understood as changes in the skills composition of labour markets), but also the impact of ageing populations and of the pension expenditure trend.
We focus on the budgetary and distributional effects elicited by these trends, once considered the role played by tax-benefit systems in the formation of household disposable incomes in the future scenarios. In particular, the tax-benefit systems of 2019 are applied to the future scenarios to analyse the budgetary and distributional outcomes (i.e. we assume no fiscal policy change). Note that by tax-benefit systems we mean personal income taxation, social security contributions, social benefits and pensions.
Following Pacifico (2014), the reweighting process can be described as follows: let us consider a survey of N individuals and K individual-level variables, such as income, gender, working status and age: xi = (xi,1 , xi,2 ,..., xi,K). The survey weight is defined as a vector s = (s1 , s2 ,..., sN) of all individual weights; the estimated 1 × K vector of survey totals is given by: 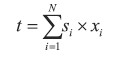 | (1) |
Since we are interested in changing our data so as to describe the future population rather than the actual surveyed population, we use the projected change of the surveyed variables in order to replace current weights by weights that will capture these changes for future years.
It is thus possible to compute a new vector of survey weights wi = ( w1 , w2 ,..., wN) that is as close as possible to the original weights while meeting the following calibrating condition: 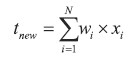 | (2) |
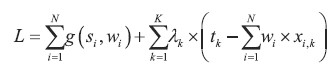
where tnew is the 1 × K vector of projected total values in the future for a given variable x. Let us assume that the distance between the original and the new weight follows a distance function g( si, wi), so that the new weights can be obtained by minimizing a Lagrangian function with respect to the new weights:
 | (3) |
where λ = ( λ1 , λ 2 ,..., λK)' are the Lagrange multipliers. Clearly, the solution of the minimization problem depends on the properties of the chosen distance function. We use the chi-squared distance function, not only because it is one of the most popular choices in the applied literature, but also because the above minimization problem has an explicit solution that can be obtained immediately without an iterative procedure. For more information, see Pacifico ( 2014). Our approach follows the reweighting approach also used by Leulescu et al. ( 2020) and Leulescu ( 2016), who perform the reweighting not on an individual but on a household level.
Since we are interested in the future changes on the labour market, we reweight the EU-SILC data in such a way that it resembles the changes in terms of age composition, employment, unemployment, skill composition and pension expenditures.
This approach allows us to mimic a population that is not only similar to the target population in expected employment trends by skills, but also in terms of labour force, as well as in the total age structure and pension expenditure. In order to ensure internal consistency in EUROMOD simulations, the reweighting reflects the projected percent change for the specific groups as described above in sections 2.2 – 2.4 for Cedefop, EUROSTAT and European Commission data. We hence generate datasets that are in line with the projected structure of the population for the years 2019, 2025 and 2030. Please note that contrary to, e.g. Dolls et al. ( 2019), we do not account for any wage response to the projected change. Wages in the different skill groups are assumed to stay unchanged, even though the labour market composition changes. In addition, it should be mentioned that the analysis also takes account of changes in pension expenditure caused by the longer working lives, in line with the aggregated data from the EU 2021 Ageing Report.
3 Results
The underlying assumptions characterise a future scenario characterised by: - an ageing population, which increases pension expenditure
- an inverted U-shape trend in unemployment rates due to the impact of the COVID-19 pandemic
- an increase in employment rates and in the participation of older workers
- a potential further polarisation of the labour market.
The impact of these trends on tax revenues and income distribution cannot be determined a priori. - on the one hand, the population over 65 would be net fiscal beneficiaries while working age individuals would be net contributors
- a negative impact of the demographic trend on government budgets can be expected
- on the other hand, the increase in high-skill jobs, could have a positive impact on tax revenues, although mitigated by the increase in the prevalence of low-skill jobs in several EU member states.
The consequences for income distribution (before and after direct taxes and social transfers) are equally difficult to predict. The following sub-section will try to shed light on these points.
3.1 Fiscal consequences of changing labour market
This subsection examines in detail the fiscal consequences of the new projected labour markets resulting from the population ageing, employment/unemployment and skill composition changes described above. The results are presented for the 27 EU member states and for the EU-27 as a whole. Our micro-approach allows us to disentangle the impacts on three main fiscal aggregates, namely: - personal income taxes and social insurance contributions (SIC) (please note that indirect taxes are not included in this analysis)
- government spending on pensions
- benefits received by households, including unemployment benefits, social assistance and family benefits.
We also analyse changes in the net budgetary positions of governments with respect to households, defined as personal income taxes and SICs minus cash benefits and pensions. Positive values indicate that governments receive from families more in direct taxes and social insurance contributions than their disbursements on cash benefits and pensions. A government’s net position with respect to households should not be confused with government deficit, as several revenue and expenditure items are not considered (e.g. revenues from corporate or indirect taxation, expenditure for public in-kind services such as health or education). In addition, the net government budgetary position is measured on a current basis, i.e. without considering possible arrears in taxes or benefits due.
Figure 6 reports the changes in the fiscal aggregates for the EU. The result follows from the aggregation over all 27 countries. Consistent with population ageing described in the previous section, pension expenditure is expected to raise by more than 20%. Revenues from taxes and social insurance contributions (SICs) are also predicted to increase by around 5%. The result is consistent with the favourable labour market developments forecast (increase in the employment rate). Expenditure in social benefits is expected to increase by about 5% in 2025, mainly because of the impact of COVID-19, but then decrease substantially until 2030.
Figure 6Changes in fiscal aggregates in the EU-27, 2019-2030 DISPLAY Figure
Figure 6 also reports the development of the net position of EU governments with respect to households as defined above. It is expected to evolve from a value of 8.2% of GDP in 2019 to about 6.9% of 2019 EU GDP in 2030.
The results show that changes in these fiscal aggregates are strongly driven by population ageing, which is expected to lead to a strong increase in pension expenditures. In order to be able to leave aside the effect of population ageing, figure 7 reports the fiscal aggregates related only to the working age population, defined as individuals aged between 15 and 64 and not receiving pensions. Taxes and SIC are expected to stay stable between 2019 and 2025, but then increase by about 5% till 2030; social benefits are expected to first increase by about 6% in 2025 and then fall to a lower level than observed in 2019. The COVID-19 related increase in unemployment contributes substantially to the pattern observed.
Consequently, the net budgetary position of governments with respect to the working age population is expected to first drop slightly from 16.6% to 16.4% of 2019 EU GDP between 2019 and 2025, but then increase up to 17.0% of 2019 EU GDP by 2030. The finding confirms the importance of population ageing for the future of public finances of EU member states.
Figure 7Changes in fiscal aggregates in the EU-27, working age individuals, 2019-2030 DISPLAY Figure
Figure 8 reports the fiscal aggregates for the entire population of each member state. Consistent with the population ageing described, pension expenditure is expected to increase in absolute terms in all EU member states, except for Greece. Several countries show an increase in pension expenditures above 50% in 2030 compared to 2019 values. The increase is especially high in Ireland, Luxembourg, Slovakia and Romania.
Direct taxes and SICs are expected to stay stable in most member states. Bulgaria and Lithuania, which are predicted to be affected by particularly non-favourable socio-demographic developments, and Czechia are expected to experience a reduction in revenues from direct taxes and SIC. Substantial increases in taxes and SICs can be observed in Austria, Cyprus, Luxembourg, Portugal and Romania over the years analysed.
Comparing 2019 and 2030, expenditure on social benefits is expected to decrease in most member states except for Spain, France, Italy, Malta and, to a lesser extent, Sweden. Increases in benefit expenditures are observed in several member states when 2025 is compared to 2019. Results are mostly driven by the unfavourable impact of COVID-19 on unemployment, in combination with potential increases in family benefits due to an increase in young cohorts in Malta and Luxembourg. Figure A2 in the appendix, reports fiscal aggregates for the active population. As expected, the government position for the active population is substantially higher than for the entire population and it shows a stable or improving pattern in most of the countries.
Figure 8Fiscal evolution index across EU member states, 2019-2030 (2019 = 100)* DISPLAY Figure
To facilitate comparison, figure 9 groups the net budgetary positions of the government with respect to households in each member state and in the EU as a whole. The data show that in 2019 all EU member states except Cyprus and Greece present a positive net position of the government with respect to households, meaning that direct taxes and SICs collected exceed government expenditure to households (cash benefits and pensions paid). The governments’ net position in 2030 is forecast to be substantially lower than in 2019 in most EU member states (with exceptions, such as Greece, Austria, Denmark and Sweden), indicating that the expected population and labour market developments described in this report pose a significant threat to the government budgets. Our results show that governments’ net positions are expected to deteriorate, and this trend is particularly significant in Eastern European countries, such as Romania, Czechia, Poland, Bulgaria, Slovenia, Slovakia and Hungary as well as in Lithuania, Spain and France.
Figure 9Net positions of governments with respect to households, 2019-2030 (% 2019 GDP) DISPLAY Figure
3.2 Distributional consequences of changing labour markets
This subsection examines in detail the distributional impact of the future changing labour markets and population ageing in EU member states and in the EU-27 as a whole. We use the results of the simulations to estimate the impact of the described macro trends on the At-risk-of-poverty (AROP) rate and income inequality indicators measured by the Gini coefficient. We also compute the redistribution index (Reynold-Smolensky Index) and the poverty reduction index to measure the redistributive power of tax-benefit systems. All these indicators on EU-level are based on population weights.
Figure 10 reports the EU average poverty rate and the Gini coefficient. The indicators are computed per country before applying population weights for each country. The EU-level poverty rate, if calculated on the basis of market income, increases from 35.2% to 36.6% between 2019 and 2030. The poverty rate on disposable income (thus including the effect of taxes and transfers) shows however a declining trend, from 16.1% to 15.2%. Similarly, the Gini coefficient, if based on market income, increases in the EU-27, from a value close to 0.494 in 2019 to 0.502 in 2030; while based on disposable income, Gini shows a decline from 0.289 to 0.284.
These results indicate that while market incomes expected from the new future labour market situation would be slightly more unequally distributed and prone to poverty risks than the current one, EU member states’ tax-benefit systems (as of 2019) seem to temper this trend.
Figure 10At-risk-of-poverty (AROP) rates and Gini coefficients in the EU-27, 2019-2030 DISPLAY Figure
The Gini coefficient, reported in figure 12 for each member state, show consistent results: the change in the distribution of market income is heterogeneous. While the Gini coefficients on disposable income usually indicate either a stable or a more equal income distribution in 2030 than in 2019. In particular, Slovakia and Romania are expected to experience a reduction in Gini coefficients on disposable income above 1 percentage point. On the other hand, in Luxembourg, Malta and Cyprus we observe an increase in the Gini-coefficient of more than 0.5 percentage point.
Figure 11 reports poverty rates for EU member states. The consequences of the sociodemographic changes on market income based poverty rates are heterogeneous, with declining trends in some countries (e.g. Austria, Cyprus, Greece and Portugal), stable patterns in others (e.g. Latvia and Germany) and increasing trends in the rest of the member states (e.g. Belgium, France and Spain). Poverty rates based on disposable income, in contrast, show typically a stable or declining trend in most countries. Significant increases, above 1 p.p., can be only observed in Cyprus and Luxembourg.
The Gini coefficients, reported in figure 12 for each member state, show consistent results: the change in the distribution of market income is heterogeneous. While the Gini coefficient on disposable income usually indicates either a stable or a more equal income distribution in 2030 than in 2019. In particular, Slovakia and Romania are expected to experience a reduction in Gini coefficients on disposable income above 1 percentage point. On the other hand, in Luxembourg, Malta and Cyprus we observe an increase in the Gini coefficient of more than 0.5 percentage point.
Figure 11At-risk-of-poverty (AROP) rate across member states, 2019-2030 (%) DISPLAY Figure Figure 12Gini coefficients across EU member states, 2019-2030 DISPLAY Figure
To assess the impact of the tax-benefit system on poverty risk and inequality, we look at the changes in standard indicators before and after government intervention (market income vs. disposable income). Figure 13 highlights the capacity of the tax-benefit systems of each EU member state to reduce poverty risks. The poverty reduction index is computed as the difference between the at-risk-of poverty rates related to market income and the at-risk-of poverty rates related to disposable income. We find that the tax-benefit systems (as of 2019, assuming no fiscal policy changes) absorb a substantial (and in most countries growing) part of the expected increase in poverty risk during the next years. This is due to the features of the tax-benefit systems, such as progressivity of taxes, means-tested benefits, complex interaction of the different elements of the systems, etc. Only Austria, Cyprus, Denmark, Greece and Latvia are expected to have a decrease in the poverty reducing property of their tax-benefit systems.
Figure 13Poverty reduction index across EU member states, 2019-2030 (p.p.) DISPLAY Figure
Figure 14 shows the capacity of tax benefit systems to reduce income inequality in the EU and in each member state. The Redistribution Index (a.k.a. ReynoldSmolensky Index) is defined as the difference between Gini coefficient on market income and Gini coefficient on disposable income. Like the poverty reduction index, the redistribution index highlights the strong and important impact of member states’ tax-benefit systems in cushioning the inequality-increasing nature of future labour market and population developments. Except with respect to Austria, Cyprus, Denmark, Latvia and Portugal, our results suggest an increasing redistribution by the tax-benefit systems up to 2030.
While the country-specific results show a high degree of heterogeneity across member states, as a consequence of the different characteristics of the EU tax-benefit systems, on average EU tax-benefit systems are expected to absorb more poverty and inequality in 2030 than they managed to absorb in 2019. These findings can be explained by the features of the tax-benefit systems, such as personal income tax progressivity and the presence of means-tested benefits. Overall, they show that the tax-benefit systems in the EU are generally more redistributive when market income is more unequally distributed. Figure 14Redistribution index across EU member states, 2019-2030 DISPLAY Figure
4 Conclusions
Future developments, such as job creation, population ageing, and changes in the skill composition of the labour force could in the next decade pose new challenges to the tax-benefit systems of the EU member states, which will need to guarantee their sustainability from a budgetary perspective and to ensure their effectiveness in fighting poverty and redistributing income. In this paper, we have used the microsimulation model EUROMOD to assess the fiscal and distributional consequences of socio-demographic projections by Cedefop, EUROSTAT and the Economic Policy Committee (2020). The use of a microsimulation model has several advantages over the macroeconomic approach which is traditionally used for this type of analysis. Microsimulation models account for the structure of the tax systems and the multiple interactions between tax and social benefits they embed. They also allow the impact of long-term trends to be assessed, both from a budgetary and from a redistributary perspective.
Overall, the data depict a scenario of an ageing population requiring increased expenditure on pensions, declining unemployment in the medium term, following a COVID-19 related peak, increasing employment rates (due to an increasing participation of older workers) and potentially polarising labour markets. The latter trend is dominated by a surge in the number of high-skill occupations. The projections used in this study were published during 2020. However, the projected trends are in line with the available data in 2023. In particular, the EU population was around 448 million in January 2023, consistent with the projected value of 449 million in 2025, and the overall upward trend in employment rate for the period 2019-2022 is also in line with the projections used in the current study. 12
Our microsimulation analysis indicates that macro-trends are expected to deteriorate the government net positions with respect to households in many EU member states. An increase in pension expenditures is expected to largely drive this finding, which holds valid despite government revenues from direct taxes and social insurance contributions are expected to increase in most countries. The finding is less clear cut when focusing on working age population only. In this case, the government net position with respect to households remains stable or improves in most EU member states.
The inverted U-shape trend in unemployment rates drives the changes in the expenditures in social benefits in most member states. In general, the labour market developments are expected to produce a more unequal distribution of market incomes and higher poverty risks (measured by the Gini index and at-risk-ofpoverty rates on market incomes, respectively). However, the tax-benefit systems of most EU member states are expected to deliver more redistribution and better absorb the poverty risks (as suggested by the measurement of the same indicators on disposable incomes).
The results depicted in this paper provide novel evidence on the likely fiscal and distributional impact of long-term demographic and technological changes using microsimulation techniques. As the results are heavily dependent on the outcome of the reweighting algorithm, future work could involve the implementation of a bootstrap analysis to compute standard errors and evaluating the statistical significance of the findings. In addition, an assessment of the extent to which the COVID-19 pandemic has affected the longer term sustainability of the tax-benefit systems could be analysed by comparing pre-COVID-19 scenarios with the results of this paper.
When interpreting our results, one has to keep some caveats in mind. First, we are using a weighting approach, which means we cannot account for potential wage effects due to changing labour demand and supply. Wages in the different skill groups are assumed to stay unchanged, even though the labour market composition changes. In addition, we assume a no-policy change scenario, which means that we do not account for potential (and likely) policy interventions in the taxbenefit system of EU member states.
Appendix
CEDEFOP SKILLS FORECAST
To forecast the development in skills composition in the medium run, several assumption have been made. Especially the insecurity related to the COVID-19 crisis highlights the importance of carefully discuss this assumptions. The main scenario assumptions can be grouped as follows: - Assumptions about the lockdown, including the nature of the lockdown restrictions, duration and any travel restrictions.
- Assumptions on labour market participation: The EU-LFS data for the latest quarter (2020Q2) of labour market participation rates was used to assess labour market participation rates by age group and gender for 2020, and the forecast for future years also considered these changes. As well as the assumptions on the impact of decreased demand on member state economies, the modelling includes some supply constraints. Short-time work schemes, absences, and temporary lay-offs are expected to lead to constraints in the sectors’ capacity to produce output, even if there is demand for the goods produced. To inform these assumptions, we have adjusted the 2020 average hours worked per week by the change observed in the first two quarters of 2020.
- Assumptions regarding changes in aggregate demand, including impacts on consumer expenditure, investment and trade: The latest statistical information for 2020 was used to inform the assumptions on changes in consumer expenditure, investment and trade. The data was used to estimate the size of the overall shock in 2020 for these indicators, as well as which economic sectors, consumer and trade goods and services were the most affected. These estimates were supplemented by qualitative information gathered regarding lockdown rules and other restrictions. For consumption expenditure, the goods most affected were expenditure on services and durable goods, with small changes assumed in the expenditure on some medical goods, rent and utilities. Regarding investment, most sectors were impacted in the first half of 2020, and in the modelling the shock to investment covered all sectors with the exception of public sectors (e.g. Health). A similar approach has been implemented for the trade assumptions. For 2021, it was assumed that the changes in demand (i.e. consumer expenditure, trade and investment) would be roughly half of those in 2020, with some of the government support measures still continuing. By the end of 2021, most short-term impacts of COVID-19 are expected to fade, although some longer-term consequences, such as degradation of skills, loss of investment capital, permanent closure of businesses, are expected to linger up to 2030 and perhaps beyond.
- Government response measures, including working arrangements, fiscal support measures and any additional final expenditure measures: Furthermore, information on government support measures such as different working arrangements and furlough schemes were used to assess the impact on wages and employment. Because of the implementation of furlough schemes across some member states, any decrease in average wages was restricted in the modelling exercise to a maximum amount below baseline levels. Information on other working arrangements was used to assess whether the employment impacts resulting from the loss of economic activity are of reasonable scale. Further adjustments were made to the initial changes in employment (e.g. to limit the loss of employment resulting from the loss of production) where different working arrangements were in place. Additional government final expenditure was also included in the assumptions, reflecting support schemes that have been implemented or announced.
It is also important to note that the preliminary results based on the above assumptions have been reviewed by country experts and this process has led to specific regional and sectoral adjustment of assumptions to reflect those comments.
Figure A1Demographic projections across EU member states, 2019-2030 (2019 = 100) DISPLAY Figure Figure A2Employment rate (right hand scale) and unamployment rate (left hand scale) projections (in %) accross EU member states, 2019-2030 DISPLAY Figure Table A1Population projections, years 2019-2030 (in %) DISPLAY Table Table A2Skill and total jobs projections, years 2019-2030 (in %) DISPLAY Table
Notes
* The content of this article does not reflect the official opinion of the European Commission. Responsibility for the information and views expressed in the article lies entirely with the author(s).
We are indebted to the many people who have helped to improve the paper substantially. A special thanks goes to Salvador Barrios (DG JRC), Ana Agúndez (DG JRC), Jörg Peschner (DG TAXUD) and Giovanni Russo (Cedefop), as well as to two reviewers for their helpful comments and advice. Additionally, we want to thank the participants of the 3rd JRC Fiscal Policy Workshop in 2021, the colleagues at JRC B2 unit, as well as the participants of the Cedefop Department for VET and Skills research seminar for helpful comments.
1 See Economic Policy Committee (2020).
2 Note that the projections used do not consider a more rapid adoption of technology because of COVID-19.
3 Intuitively, Dolls et al. (2019) estimate a relationship between education, population ageing and wages. Projecting changes in ageing and education, they predict changes in wages. We keep wage skill premiums constant, but we modify the number of people in each age category, the proportion of workers and the skill composition such that we replicate the trends seen in the projections.
4 EUROMOD is used to simulate the impact certain changes in the tax-benefit system may have on individuals’ income. In its standard version, the model does not take into account behavioural changes that may follow these changes, thus it delivers “morning after” effects. However, it can be linked to other models for behavioural analysis and general equilibrium effects.
5 EU-SILC User Data Base(UDB) data, distributed by ESTAT, have been complemented with information from national SILC data in Austria, Czechia, Estonia, Greece, Italy, Lithuania, Luxembourg, Poland and Slovakia.
6 Taxes and benefits that cannot be simulated because of lack of relevant information in the data are used as recorded in EU-SILC.
7 See also https://www.cedefop.europa.eu/en/events-and-projects/projects/skills-forecast and https://www.cedefop.europa.eu/en/publications-and-resources/publications/4201.
8 Forecasts are based on harmonized data and a single methodology (see Cedefop, 2012) to obtain comparable results across countries.
9 Please note that jobs in the armed forces are counted in the total number of jobs, but not in the skill classification.
10 See Economic Policy Committee (2020).
11 `Nowcasting’ means the forecasting of variables or indicators in current or recent times or in the very near future, as opposed to survey data which are usually available with a time lag.
12 Data on population in 2023 and employment in 2022 were both retrieved in October 2023 from EUROSTAT database, online data codes tps00001 and lfsi_emp_a__custom_7829993.
* The content of this article does not reflect the official opinion of the European Commission. Responsibility for the information and views expressed in the article lies entirely with the author(s).
We are indebted to the many people who have helped to improve the paper substantially. A special thanks goes to Salvador Barrios (DG JRC), Ana Agúndez (DG JRC), Jörg Peschner (DG TAXUD) and Giovanni Russo (Cedefop), as well as to two reviewers for their helpful comments and advice. Additionally, we want to thank the participants of the 3rd JRC Fiscal Policy Workshop in 2021, the colleagues at JRC B2 unit, as well as the participants of the Cedefop Department for VET and Skills research seminar for helpful comments.
1 See Economic Policy Committee ( 2020).
2 Note that the projections used do not consider a more rapid adoption of technology because of COVID-19.
3 Intuitively, Dolls et al. (2019) estimate a relationship between education, population ageing and wages. Projecting changes in ageing and education, they predict changes in wages. We keep wage skill premiums constant, but we modify the number of people in each age category, the proportion of workers and the skill composition such that we replicate the trends seen in the projections.
4 EUROMOD is used to simulate the impact certain changes in the tax-benefit system may have on individuals’ income. In its standard version, the model does not take into account behavioural changes that may follow these changes, thus it delivers “morning after” effects. However, it can be linked to other models for behavioural analysis and general equilibrium effects.
5 EU-SILC User Data Base(UDB) data, distributed by ESTAT, have been complemented with information from national SILC data in Austria, Czechia, Estonia, Greece, Italy, Lithuania, Luxembourg, Poland and Slovakia.
6 Taxes and benefits that cannot be simulated because of lack of relevant information in the data are used as recorded in EU-SILC.
8 Forecasts are based on harmonized data and a single methodology (see Cedefop, 2012) to obtain comparable results across countries.
9 Please note that jobs in the armed forces are counted in the total number of jobs, but not in the skill classification.
10 See Economic Policy Committee ( 2020).
11 `Nowcasting’ means the forecasting of variables or indicators in current or recent times or in the very near future, as opposed to survey data which are usually available with a time lag.
12 Data on population in 2023 and employment in 2022 were both retrieved in October 2023 from EUROSTAT database, online data codes tps00001 and lfsi_emp_a__custom_7829993.
Disclosure statement
The authors have no potential conflict of interest to report.
References
Acemoglu, D. and Restrepo, P., 2017. Secular stagnation? The effect of aging on economic growth in the age of automation. American Economic Review, 107, pp. 174-179 [ CrossRef]
Autor, D., Katz, L. and Kearney, M., 2006. The Polarization of the US Labor Market. The American Economic Review, 96(2), pp. 189-194 [ CrossRef]
Autor, D., Levy, F. and Murnane, R., 2003. The skill content of recent technological change: An empirical exploration. The Quarterly Journal of Economics, 118(4), pp. 1279-1333 [ CrossRef]
Aziz, O. A., Ball, C. and Creedy, J., 2015. The distributional impact of population ageing in New Zealand. New Zealand Economic Papers, 49(3), pp. 207-226 [ CrossRef]
David, H. and Dorn, D., 2013. The growth of low-skill service jobs and the polarization of the us labor market. American Economic Review, 103(5), pp. 1553-1597 [ CrossRef]
Dolls, M. [et al.], 2017. Fiscal sustainability and the demographic transition: a micro approach for 27 EU countries. International Tax and Public Finance, 24(4), pp. 575-615 [ CrossRef]
Dolls, M. [et al.], 2019. Demographic change and the European income distribution. The Journal of Economic Inequality, 17, pp. 337-357 [ CrossRef]
Economic Policy Committee, 2020. The 2021 Ageing Report - Underlying Assumptions and Projection Methodologies. European Economy Institutional Paper, No. 142.
Frey, C. and Osborne, M., 2017. The future of employment: How susceptible are jobs to computerisation? Technological Forecasting and Social Change, 114, pp. 254-280 [ CrossRef]
Goos, M and Manning, A., 2007. Lousy and lovely jobs: The rising polarization of work in Britain. The Review of Economics and Statistics, 89(1), pp. 118-133 [ CrossRef]
Goos, M, Manning, A. and Salomons, A., 2009. Explaining Job Polarization in Europe: The Roles of Technology, Globalization and Institutions. American Economic Review Papers and Proceedings, 99(2), pp. 58-63 [ CrossRef]
Goos, M., Manning, A. and Salomons, A., 2014. Explaining job polarization: Routine-biased technological change and offshoring. The American Economic Review, 104, pp. 2509-2526 [ CrossRef]
Michaels, G., Natraj, A. and Van Reenen, J., 2014. Has ict polarized skill demand? evidence from eleven countries over twenty-five years. Review of Economics and Statistics, 96(1), pp. 60-77 [ CrossRef]
Pacifico, D., 2014. Sreweight: A Stata command to reweight survey data to external totals. The Stata Journal, 14(1), pp. 4-21 [ CrossRef]
Prettner, K. and Strulik, H., 2020. Innovation, automation, and inequality: Policy challenges in the race against the machine. Journal of Monetary Economics, 116, pp. 249-265 [ CrossRef]
Sutherland, H. and Figari, F., 2013. EUROMOD: the European Union tax-benefit microsimulation model. International Journal of Microsimulation, 6(1), pp. 4-26 [ CrossRef]
|


