|
|
|
Abstract
Does taxation structure have an impact on investment dynamics? In our paper we evaluate the share of tax revenues in GDP and investment outcomes, making use of gross fixed capital formation as a proxy for investment. This empirical analysis is carried out for all OECD countries, during the period of 1980-2015, to assess the tax system composition effects in both the short and the long-run. Resorting to panel data econometric techniques, the paper also aims to find optimal tax-investment threshold values. Our results lead us to conclude that there is a maximising effect of income taxation on investment growth when revenues from this tax source are about 10.7%. Furthermore, we find that revenues from social security contributions are detrimental to growth, in both the short and the long-run, while tax revenues from firms and consumption are only detrimental in the short-run.
Keywords: investment growth; tax systems; fiscal policy; optimal taxation
JEL: D25, E62, H21, O47
1 Introduction
Since Adam Smith shared thoughts and reflections of an economic nature in The Wealth of Nations, it has become clear that investment is fundamental for economic development. Nowadays, be they academics or not, everyone recognises the validity of this hypothesis quite nonchalantly. Investment is promoted as a guarantee of long-run growth, is seen almost as an input for an economic unit to be able to function perfectly, in a sustainable way.
In fact, investment enables sustainable consumption in the long-run, by applying economic productive factors in both old and new economic production processes. This allows us to create not only more products for exchange in markets, but also more opportunities to intensify the trade of previous investments. This is because investment decisions can improve the older production processes through efficiency gains, allowing the creation of more added value.
On the other hand, the existence of the state can jeopardise investment decisions. For when a government levies taxes on the private side of the economy, in effect it reduces both private consumption and investment. Taxation can jeopardise investment decisions, particularly when the increase in revenues of both income and consumption taxes from the private-side of an economy can both lead to a reduction in the level of aggregate consumption and also decrease investment profitability rates through the reduction of the expected aggregate demand for the outcomes of these investments.
It is also true that funds raised from taxes are spent through government consumption and investment. Furthermore, apart from the fact that the main purpose of taxes is to guarantee sufficient funds to conduct various fiscal policies, taxes are also levied on economic agents to correct for externalities that arise from the production process. In this case, taxes play a kind of a broker role for any nefarious behaviour of the productive process over the many dimensions of an economy, such as the environment, for example. Additionally, taxes can stimulate certain production process behaviours which present good externalities for the economy, as in the case of investment in human capital for the production process.
On the other hand, from a macroeconomic perspective, the utility of taxation can be positively justified. When investment levels are beyond the optimal level, i.e. they are not in accordance with an optimal consumption balanced path, it is imperative to promote the reduction of investment decisions. This happens when the condition of economic dynamic efficiency is not verified, i.e. when the return rate on capital exceeds investment growth rates. Put more specifically, a non-optimal level of investment is verified when the marginal product of capital is less than the economic growth rate – as illustrated in several economic exogenous growth theories, such as, for instance, in Solow (  1956 1956); Swan ( 1956) and Ramsey ( 1928); Cass ( 1965); Koopmans ( 1963). In contrast to this perspective, when investment levels are below the optimal level required to guarantee a sustainable growth path, one point of view is that government intervention is required – through public spending and an increase in investment. In fact, there is empirical evidence sustaining the argument that an increase in public investment can lead to crowding-in effects in private investment, and, therefore, lead to increases in aggregate investment levels (Afonso and St. Aubyn, 2009).
Furthermore, several tax arrangements can have a decided impact on investment decisions. If governments decide to levy less tax on individual income, for example, this may lead to increase aggregate demand for both durable and non-durable goods which may not only give rise to higher profits but provide new investment opportunities. Moreover, when fiscal authorities decide to change corporate tax rates, they influence several branches of economic activity. In particular, tax benefits can lead to specialization in economic activities with higher added-value for the overall economy. Additionally, tax rises on consumption, on property and social security contributions lead generally to a reduction of current consumption. These tax policies may impact on movements of interest rates, depressing them and promoting investment decisions, in general.
According to the analysis above, we think that it is essential to analyse the effects of taxation on investment dynamics. Is it possible empirically to find a correlation between taxation structure and investment dynamics outcomes? In particular, is there a relationship to be found between each source of tax revenue and GDP and investment performance? These questions point up the importance of studying the way in which investment is influenced by fiscal policy. We recognise that this issue has already been studied in depth; however, academic researchers have mainly studied this relationship from the angle of the spending side of fiscal policy. We therefore think that it is important to revisit the investment – fiscal policy relationship looked at from the revenue side of fiscal policy. Accordingly, when taking it into consideration that tax revenues are reintroduced into the economic circuit via overall government expenditure, control variables are required to assess the tax structure – investment connection. On the other hand, we are aware that the macroeconomic study of taxation has not taken into account the particularities of each tax incidence, or any other tax exemptions or tax law particularities capable of explaining the different degrees of compliance of each tax, in each country under analysis. However, having decided to develop this study from a macroeconomic perspective, we think that an optimal structure of taxation can result in a better design of each tax. In specific terms, we believe that our research is a good starting point for studying taxation analysis in more depth, and for being able to reach, at the same time, a higher rate of tax compliance, resulting in greater efficiency and reliability from the microeconomic perspective – ensuring the muchneeded revenues that governments require to conduct their policies.
Our results lead us to conclude that there is an investment threshold with respect to some tax revenue sources. In particular, with the exception of taxes on individual income, an increase of revenues from tax sources seems to be detrimental to investment dynamics. Furthermore, even though we achieve a maximizing effect of almost 11% of revenues from individual income taxes, in GDP terms, in the shortrun, we do not find evidence for optimal thresholds for income tax in the long-run.
This study is organised into the following sections: section 2 provides a brief review of the existing literature on the causalities of taxation on investment; section 3 highlights the applied methodology and also the databases used in this analysis; section 4 details the obtained results, and, lastly, section 5 summarises our conclusions.
2 Literature review
The existing literature on taxation is vast. With respect to the impact of taxation on economic performance, it is particularly worth mentioning the studies conducted in Lee and Gordon ( 2005), where the authors evaluate the tax structures and their impact on economic growth for a set of 70 countries over the last three decades of twentieth century, concluding that while their results point out the negative impact of corporate taxes on growth, labour income taxes are not significant for economic performance. This negative result regarding the impact of corporate taxes on growth is also confirmed by Arnold ( 2008), assessing 21 OECD countries’ tax structures over a period of more than 30 years. On the opposite side, this author concludes that taxation of property and consumption enhances growth more, which is also in accordance with Xing’s ( 2010) results. In fact, this author also concludes that levying taxes on income, both individual and corporation, as well as on consumption is associated with lower long-term per capita GDP. Lastly, Grdinic, Drezgic and Blazic ( 2017) assess the correlation between economic evolution and tax composition in Central and Eastern European countries, concluding that taxation arrangements present different effects than those in the existing literature investigating the effects of taxation in OECD countries. In specific terms, the authors claim there is a negative impact of all taxation on growth, underlining income taxes as the source of revenue most detrimental to growth.
In respect of the relationship between taxation and investment, this subjects has also been deeply studied from different perspectives in economics. In fact, some of the literature has highlighted the impact of tax policies on investment behaviour, especially corporate income tax and its effects on investment decision-making processes. For instance, a study conducted by Da Rin, Sembenelli and Di Giacomo ( 2010) makes use of panel data techniques to assess the impact of taxation on firms for a set of more than 2.5 million firms in 17 European countries, during the period of 1997-2004. The authors conclude that a corporate tax reduction is related with a decreasing capital-labour ratio, and, specifically, the impact of corporate taxes is stronger on capital than on labour. However, as the authors point out, a tax reduction is desirable for the promotion of the entry of firms into the market – however, this policy can also favour the entry of less-financially robust firms. The same conclusion regarding the effect of corporate taxation and market entry is reached in Braunerhjelm and Eklund ( 2014), where the authors verify that a 10% reduction in corporate taxation increases market entry by 3%. Complementing the previous conclusions, research conducted in Da Rin, Di Giacomo and Sembenelli ( 2011) concludes that there is a non-linear relationship between tax and firm entry into the market.
On the other hand, in a study of 14 developed countries during the period of 1982- 2007, Bond and Xing ( 2015) find a negative relationship between taxes on firms and their effects on a firm’s capital – output ratios. The authors develop an econometric specification derived from a constant elasticity of substitution in a neoclassical model of investment, finding in both short- and long-run that a 1% increase in a firm’s taxation has a negative impact on capital-output ratios of between -0.3% and -0.7%. These results are also corroborated by Djankov et al. ( 2010) for a sample of 85 countries in 2004. Additionally, these authors also found that, with respect to the tax effects on industries, manufacturing is more exposed than other segments to the detrimental effects of corporate taxation. These conclusions are also reached in Mukherjee, Singh and Žaldokas ( 2017). However, besides finding a negative correlation between taxes on corporate income and R&D activities, the authors also conclude that higher taxes result in a reduced supply of new goods and services into the market economy. Furthermore, by analysing the effects of consumption taxes on corporate investment decisions, Jacob, Michaely and Müller ( 2017) conclude that this source of taxation is also detrimental to a firm’s investment policy. The results reached by the authors led to the conclusion that the detrimental effect of consumption taxation is stronger for firms with a higher degree of demand elasticity, besides having a higher exposure to domestic final consumers and to financial restrictions.
With regards to the effect of taxation on firm size and ownership, Galindo and Pombo ( 2011) find that corporate taxes affect big firms more than small and medium sized firms, regarding investment decisions and productivity. In addition, Brandstetter and Jacob ( 2013) apply a difference-in-differences approach to assess the effect of corporate tax on investment dynamics for the German case, and find heterogeneous responses – i.e. a cut in corporate tax can lead to growth in investment for domestically-owned firms higher than that of foreign-owned corporations. However, Baliamoune-Lutz and Garello ( 2014) found that tax progressivity tends to stimulate market entry more in low-to-average income than in highincome individuals.
With regards to the productivity-tax linkage, empirical research carried out by Gemmell et al. ( 2016) for a set of 11 European countries between 1996 and 2005 concludes that while higher statutory corporate tax rates impact the productivity levels of small firms negatively, the productivity of bigger firms is only affected by effective marginal tax rates. Additionally, Langenmayr, Haufler and Bauer ( 2015) highlight the fact that the existence of an optimal corporation tax structure depends on the degree of competition. The authors conclude that when the degree of market competition is low, higher taxes favour firms with high productivity. Conversely, when the degree of competition is in alignment with competitive market conditions and firms’ taxes on profit are low, then low-productivity firms tend to be favoured.
Another topic is tax burden and its relationship with risk-taking decisions for firms’ investment. On this subject, Ljungqvist, Zhang and Zuo ( 2017) conclude that the response to a tax change is not symmetric. In fact, the results suggest that a tax increase is accompanied by a reduction in R&D, among other activities. The authors also conclude that only low financial leverage firms react to tax cuts when it comes to risk-increasing investment decisions. In addition, a study carried out by Ljungqvist and Smolyansky ( 2016) on the effect of corporate taxation on employment and income in the United States, between 1970 and 2010, concluded that while a reduction in corporate taxes has little impact on economic growth, tax cuts during an economic contraction can bring about an increase in both levels of employment and income.
From the macroeconomic perspective, several studies also assessed the effects of fiscal policies on investment dynamics. In particular, an empirical study was carried out by Vergara ( 2010) to assess the linkage between tax reforms and investment dynamics for the case of Chile, between 1975 and 2003. The paper’s conclusion is in accordance with the theoretical predictions regarding the tax-investment relationship – namely that a reduction of corporate income tax led to a boost in investment in Chile. Furthermore, the author also discovered two channels that explain the negative correlation between taxes and investment: one is related with the positive correlation between higher tax rates and capital costs, and the other is related to higher taxes with liquidity constraints derived from a reduction of the availability of internal funds to promote investment. Additionally, Romer and Romer ( 2010) evaluated the dynamics of post-WWII tax changes in investment for the United States, and found that the negative sensitivity of investment to positive tax changes is quite large. In fact, on a quarterly basis, investment seems to reduce by almost 12% in response to a positive tax shock. This magnitude is much greater than the sensitivity of both GDP and consumption to tax increases. Furthermore, Mertens and Ravn ( 2012) evaluate the impact of both anticipated and unanticipated tax shocks for the U.S. economy, making use of VAR econometric techniques for the second-half of the 20th century. Their conclusions follow the theoretical predictions – and the authors highlight the important role of anticipated tax shocks for the dynamics of several economic issues.
On the other hand, Mountford and Uhlig ( 2009), resorting to the same econometric techniques, conclude that not only is there a negative response of investment to an increase in fiscal revenues, but also that a public budget deficit crowds out investment, which is also corroborated in Barro and Redlick ( 2011). Additionally, and besides coming to the same negative conclusions about the investment-taxes nexus, Alesina and Ardagna ( 2010) reached the conclusion that fiscal consolidation via taxation is more detrimental than via the spending side. In fact, raising taxes is more likely to produce economic recessions, and a more inefficient control of government deficit and debt dynamics when compared with fiscal adjustment via cuts in government expenditures.
Finally, Afonso and Jalles ( 2015) evaluate the impact of fiscal policy on investment for a large panel of 95 countries, during 38 years. While the authors find that private investment evidences a negative correlation with social security spending for all OECD countries, they also found that interest payments and subsidies have detrimental effects on both public and private investments. It is thus clear that the study of taxation structure and investment dynamics can provide new insights leading to the promotion of the latter without hampering government in its implementation of fiscal policies.
3 Methodology and data
In order to empirically study the impact of taxation on investment growth, we determined that investment dynamics is a function of taxation composition. More specifically, the share of each tax revenue source, as a percentage of GDP, is denoted by T, of the ΔI = F(T) type, as detailed in equation (1). Furthermore, we make use of gross fixed capital formation growth rate as a proxy for investment growth.
ΔIi,t = βi,t + β1yi,t-1 + ∑βnτn,i,t + βjxi,t + νi+ηt+εi,t
j=1,2, t = 1,..., T, i = 1,..., N
| (1) |
where ΔIi,t is the investment growth rate (annual or 5-years average), yi,t –1 is the one-lag real per capita GDP, τn,i,t represents the revenue of each tax item n, in GDP terms, xi,t represents the set of control variables, vi and ηt are, respectively, the country and time-specific effects, and εi,t is the error term of the white noise-type.
Additionally, and in order to assess the existence of non-linear effects of taxation structure on investment decisions, we decided to introduce a squared term, as demonstrated in equation (2).
ΔIi,t = β0 + β1yi,t-1 + ∑β2τn,i,t +∑β3i2n,i,t + βjxi,t + νi+ηt+εi,t
t=1,…,T, i=1,…,N | (2) |
Therefore, by deriving equation (2) in respect for each tax component, τn,i,t, as expressed in equation (3), and by then equalising the derivative function to zero, as detailed in equation (4), we can obtain each tax item threshold in respect to investment growth:

| (3) |
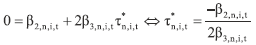 | (4) |
Therefore, if we obtain a significant negative signal for β3,i,t, we thus have a concave relationship between a tax item and the investment dynamic, which translates into an optimal value for that tax source to maximise investment. On the other hand, a convex relationship through a positive coefficient for β3,i,t translates into a value that hampers investment growth decisions. Therefore, in the empirical results section, when we obtain non-linear relations, we then highlight each coefficient to differentiate between maximum and minimum optimal levels.
The model computed in this paper considers the period between 1980 and 2015, for all the OECD countries: Australia (AUS), Austria (AUT), Belgium (BEL), Canada (CAN), Chile (CHL), the Czech Republic (CZE), Denmark (DNK), Estonia (EST), Finland (FIN), France (FRA), Germany (DEU), Greece (GRC), Hungary (HUN), Iceland (ISL), Ireland (IRL), Israel (ISR), Italy (ITA), Japan (JPN), South Korea (KOR), Latvia (LVA), Luxembourg (LUX), Mexico (MEX), the Netherlands (NLD), New Zealand (NZL), Norway (NOR), Poland (POL), Portugal (PRT), the Slovak Republic (SVK), Slovenia (SVN), Spain (ESP), Sweden (SWE), Switzerland (CHE), Turkey (TUR), the United Kingdom (GBR) and the United States (USA).
The database used in our analysis includes data from several sources: PPP per capita GDP ( realgdppc); public debt ( debt) and total government spending ( totexp) – both as a ratio of GDP, output gap, as a percentage of potential GDP ( outputgap) are all obtained from the World Economic Outlook (IMF). On the other hand, taxes on income, profits and capital gains of individuals ( taxinc), as well as taxes on income, profits and capital gains of corporates ( taxfirms), social security contributions ( ssc), taxes on payroll and workforce ( taxpayroll), taxes on property ( taxprop), taxes on goods and services ( taxvat), gross fixed capital formation ( gfcf) and its growth rate ( gfcfgr) were all retrieved from the OECD.Stats database. Age dependency ratio, as a percentage of active population ( ageratio), and also deposit interest rate ( depositrate), net foreign direct investment-to-GDP ratio ( foreigninvestment), and GDP percentage of household final consumption expenditure ( hconsggdp) are all collected from World Development Indicators (WDI). Population in millions (pop) and the real total factor productivity ( rtfpna) were obtained from the data of Feenstra, Inklaar and Timmer ( 2015). Lastly, the liquid liabilities-to-GDP ratio ( llgdp) is based on International Financial Statistics (IFS), from the IMF. Table 1 presents the summary statistics for each variable used in our regressions.
For the estimation of the coefficients, we resort to panel data techniques, applying the OLS, OLS-Fixed Effects (FE), by resorting to the Hausman Test to evaluate if the respective specification should be run with fixed effects 1, Generalized Method of Moments (GMM) and Robust Least Squares (RLS) resorting to the M-estimation technique.
With the exception of RLS, all these estimations assume the white diagonal covariance matrix hypothesis. Additionally, we estimate both equations (1) and (2) for both annual and 5-year average growth rates. Lastly, we only discuss the existence of a threshold when the coefficients of each tax item present statistical significance for both linear and square term tax regressors, for a minimum of 90% confidence interval.
Table 1Summary statistics of the variables set for investment regressions, 1980-2015 DISPLAY Table
4 Empirical analysis
4.1 Short-run effects of taxation on investment dynamics
The short-run analysis for equation (1), i.e. without the tax items square terms, show that tax burden has, in general, a negative impact on investment dynamics. In detail, a unit increase in the tax burden of individual income taxes is associated with a decrease of 0.14%, approximately, while an increase in the tax on firms’ revenues, as a proportion of GDP, presents a negative elasticity greater than the unity (-1.15), on average. Moreover, revenues of social security contributions also show an average reduction of -0.66% by a percentage point increase in this tax source. In fact, these obtained results are expected: taxes levied on household income and on social security contributions reduce aggregate demand and, therefore, they reduce the demand for goods and services, which can decisively influence new investment decisions. On the other hand, it is certain that a rise in the tax burden on these two sources can indicate wage rises, which cut into firm profits, decreasing the expected returns of previous investments, as well as of any new investments. Furthermore, a rise of taxes on firms, controlled by the cyclical conditions of the economy, also reduces the expected present value of future investment, leading investors to postpone their decisions to promote capital growth and, therefore, the aggregate level of investment. For the same reasons, the negative coefficients obtained for taxes on consumption of goods and services as well as for taxes on property are expected in line with traditional economic theory. Yet, and if we admit that the increase of revenues from taxes on consumption results from changes in tax rates, the price system will incorporate those tax policy changes, reducing investment opportunities. In fact, even if firms can accommodate a higher tax rate without changing their prices, the net profits will necessarily decrease, increasing the time required for an investment decision to result in a profit.
With regards to the control variables, we also find the expected signs. Specifically, a rise in deposit interest rates may be a sign of a consequent increase in lending interest rates, if bank entities decided to keep their spreads. In that sense, an upward movement of deposit rates is associated with a decrease of investment of about 0.4%. On the other hand, we conclude that there is a surprisingly negative impact of foreign investment on aggregate investment decisions. However, the magnitude of this effect is very small, representing a negative impact of no more than 0.08% on aggregate investment growth by an increase of a percentage point of foreign investment. In fact, this result needs to be more accurately explored. This result may arise from the substitution and complementary degree between aggregate investment and foreign investment. Furthermore, household consumption seems to be detrimental to investment growth, which can be explained by the reduction of savings and consequently fewer funds being available for capital allocations and other investment decisions.
Looking in detail at the government debt growth impact, it seems that this variable crowds out aggregate investment. On the other hand, while there is no evidence that growth in the public expenditure and age dependency ratio influences investment decisions, and the output gap is revealed to be procyclical with gross fixed capital formation – ranging between 0.27% and 0.74%. This positive effect can be explained by the fact that when the economy is overheating, inflation pressures tend to decrease the amortization time of the investment, and, consequently, to increase its profitability.
With regards to tax item thresholds for investment decision-making, through the use of the growth rate of gross fixed capital formation, it is possible to verify the non-existence of these thresholds for both taxes on payrolls and taxes on property. Regarding the other tax items, we obtained a value of 10.65% for taxes on individual income on GDP, which translates to the maximum value that promotes investment, while we see minimizing values on average of 12.09% for social security contributions, and of 7.37% and 14.18% for tax on firms and consumption, respectively. The values of these last three tax items evidence their minimum revenue, as a proportion of GDP, which is required to promote growth in investment. The above-mentioned results are presented in table 2.
Table 2Linear and non-linear short-run impact results of taxation structure on investment decisions DISPLAY Table
4.2 Long-run effects of taxation on investment dynamics
From a long-run perspective, with regards to linear relationships between tax revenues and investment (see Regressions (9), (11), (13) and (15)), the results obtained highlight patterns similar to those verified for short-run effects on tax items and investment growth, the exception being property tax – which appears to be irrelevant for determining investment decisions in the long run. In addition, we can observe that the values presented in tables 2 and 3 highlight similar magnitudes for the coefficient of taxation items in investment growth.
Regarding the other control variables, as in the short-run perspective, we find that population size shows a contradictory signal. Furthermore, household consump tion and output gap variables highlight a non-clear effect on investment dynamics, as these last two variables also present different signals, depending on the econometric technique used.
Nevertheless, it seems that deposit interest rates have a negative effect on investment from a long-term perspective. For example, a 1 p.p. increase in deposit interest rates tends to lead to a decrease in investment of between 0.4 p.p. and 0.6 p.p., approximately. Furthermore, government spending variation also seems to gain importance in the long term – presenting a slightly negative impact on gross fixed capital formation.
With regards to the analysis of the non-linear relationships of tax items on investment decisions, by computing the consequent existing tax items-to-investment thresholds, we find maximum values of 6.27% and 9.19% for taxation on firms’ profits and for consumption taxes, respectively. By contrast, we find a minimum threshold value for social security contributions of 11.35%. In the long run, and similarly to what we can observe in the short-run analysis, we can also conclude for the non-existence of any threshold values for payroll taxes. The above-discussed results may be observed in detail in table 3.
Table 3Linear and non-linear long-run impact results of taxation structure on investment decisions DISPLAY Table
Lastly, based on the results presented in table 1, which allow a comparison of the short- and long-term results for each tax item from the econometric regressions, we are also able to conclude that a certain fiscal space exists to raise some taxes. In fact, with the exception of payroll taxes and property taxes, we have found optimal values for the other tax sources. In detail, we derived maximum threshold levels for income taxes, in the short run, and corporate taxes, over the long term, in order to promote higher investment growth rates. In fact, and by comparing the optimal values reached with the mean values of table 4, we can state that we can raise the share of income taxes in GDP, in the short-term, by almost 2 p.p., while we can raise tax revenues from corporate income by 3.5 p.p., in the long-term.
Moreover, there is no incentive to change the tax burden in the short-term, since the optimal average value (7.37%) represents a minimizing threshold. Therefore, if fiscal policy intends to raise taxes from firms, it will jeopardize investment decisions in the short-term. This conclusion is also valid for social security contributions, for both short- and long-run analysis, and also for taxes on consumption, only for a short-run perspective. Moreover, as we can observe, as the average value of consumption taxes, as a proportion of GDP, is above the optimal threshold value, there is an incentive for fiscal policy to reduce the tax burden on this tax source to efficiently promote gross fixed capital formation.
Furthermore, and as a concluding reflection exercise, we can obtain optimal tax structures. Indeed, if we sum the values of all the optimal threshold tax items with the historical average recorded for taxes, we conclude that taxation as a share of GDP should be around 46.41% and 37.75% in the short-run and long-run, respectively. Lastly, table 4 summarises our main findings regarding average tax threshold values.
Table 4Summary of tax items threshold values for investment decisions DISPLAY Table
5 Concluding remarks
Investment is a crucial dimension of economic science, as it guarantees not only consumption in the long run, but also a sustainable growth path. However, we are aware that there are many other factors that can influence the dynamics of investment within the various economies under study. One of these factors is taxation: besides the taxes levied on firms’ profits, taxes affect several economic aggregates that may impact decisively on investment decisions. Additionally, taxation is recognised a priori as being detrimental to investment. Therefore, our goal is to disentangle the relationship between tax systems and investment dynamics.
In detail, it can be seen that in this study we have developed an empirical model to assess both linear and non-linear correlations between tax compositions in terms of GDP, investment, which is proxied by gross fixed capital formation. Additionally, our attempt to uncover possible non-linear impacts of the several tax sources led us to conclude the existence of optimal tax item revenue thresholds with regard to investment changes. This empirical exercise was carried out with the use of panel data techniques, for both the short- and long-term perspective for all OECD countries, between 1980 and 2015.
The results achieved evidence the existence of certain tax-to-GDP thresholds. Specifically, some optimal values of tax items as a proportion of GDP maximise investment decisions. In particular, regarding the short-run, we found a maximising threshold for the promotion of long-run investment growth of 10.65% for taxes on individual income. On the other hand, we come to the conclusion eventually that maximum threshold levels to promote investment growth exist for taxes on firms’ profits and taxes on the consumption of goods and services, of 6.27% and 9.19%, respectively. Furthermore, we found a minimum threshold of 11.35% for social security contributions.
With regards to the short-run, we only found one maximum threshold of 10.65% for taxes on individual income, while a minimum threshold value of 12.09% was found for social contributions. In addition, we found minimum threshold values, on average, of 7.37% and 14.18% for profits and consumption of goods and services taxes, respectively.
These results are of extreme importance. They give new insights into the optimisation of tax systems with respect to investment decisions. Consequently, several research lines could be pursued in the future to study deeper each tax source design in order to efficiently guarantee a tax that could ensure high levels of compliance, without jeopardising investment decisions. Several other analyses could also be carried out with the objective of finding possible complementary or competing roles between taxes and other macroeconomic variables. In sum, our article gives new insights that must be explored for a better understanding of tax systems.
Funding
This research paper is supported by Universidade de Lisboa and ISEG – Lisbon School of Economics and Management, through a PhD Support Scholarship.
Notes
* The opinions expressed herein are those of the author and do not necessarily reflect those of his employers. The author thanks two anonymous referees for helpful comments. Any remaining errors are the author’s sole responsibility.
1 For reasons of parsimony we do not provide the Hausman test results in the article, although they are available upon request.
Disclosure statement
No potential conflict of interest was reported by the author.
References
Afonso, A. and Jalles, J. T., 2015. How Does Fiscal Policy Affect Investment? Evidence from a Large Panel. International Journal of Finance & Economics, 4, pp. 310-327 [ CrossRef]
Afonso, A. and St. Aubyn, M., 2009. Macroeconomic Rates of Return of Public and Private Investment: Crowding-in and Crowding-out Effects. The Manchester School, 77(s1), pp. 21-39 [ CrossRef]
Alesina, A. and Ardagna, S., 2010. 2 Large Changes in Fiscal Policy: Taxes versus Spending. Tax Policy and the Economy, 24(1), pp. 35-68 [ CrossRef]
Arnold, J., 2008. Do Tax Structures Affect Aggregate Economic Growth? Empirical Evidence from a Panel of OECD Countries. OECD Economics Department Working Papers, No. 643 [ CrossRef]
Baliamoune-Lutz, M. and Garello, P., 2014. Tax structure and entrepreneurship. Small Business Economics, 42(1), pp. 165-190 [ CrossRef]
Barro, R. J. and Redlick, C. J., 2011. Macroeconomic Effects From Government Purchases and Taxes. The Quarterly Journal of Economics, 126(1), pp. 51-102 [ CrossRef]
Bond, S. and Xing, J., 2015. Corporate taxation and capital accumulation: Evidence from sectoral panel data for 14 OECD countries. Journal of Public Economics, 130(Supplement C), pp. 15-31 [ CrossRef]
Brandstetter, L. and Jacob, M., 2013. Do corporate tax cuts increase investments? Berlin: Arbeitskreis Quantitative Steuerlehre [ CrossRef]
Braunerhjelm, P. and Eklund, J., 2014. Taxes, tax administrative burdens and new firm formation. Kyklos, 67(1), pp. 1-11 [ CrossRef]
Cass, D., 1965. Optimum Growth in an Aggregative Model of Capital Accumulation. The Review of Economic Studies, 32(3), pp. 233-240 [ CrossRef]
Da Rin, M., Di Giacomo, M. and Sembenelli, A., 2011. Entrepreneurship, firm entry, and the taxation of corporate income: Evidence from Europe. Journal of Public Economics, 95(9), pp. 1048-1066 [ CrossRef]
Da Rin, M., Sembenelli, A. and Di Giacomo, M., 2010. Corporate Taxation and the Size of New Firms: Evidence from Europe. Journal of the European Economic Association, 8(2-3), pp. 606-616 [ CrossRef]
Djankov, S. [et al.], 2010. The Effect of Corporate Taxes on Investment and Entrepreneurship. American Economic Journal: Macroeconomics, 2(3), pp. 31-64 [ CrossRef]
Feenstra, R. C., Inklaar, R. and Timmer, M. P., 2015. The Next Generation of the Penn World Table. American Economic Review, 105(10), pp. 3150-3182 [ CrossRef]
Galindo, A. J., and Pombo, C., 2011. Corporate taxation, investment and productivity: A firm level estimation. Journal of Accounting and Taxation, 5(7), 158-161.
Gemmell, N. [et al.], 2016. Corporate Taxation and Productivity Catch-Up: Evidence from European Firms. The Scandinavian Journal of Economics, 120(2), pp. 372-399 [ CrossRef]
Grdinic, M., Drezgic, S. and Blazic, H., 2017. An Empirical Analysis of the Relationship between Tax Structures and Economic Growth in CEE Countries. Ekonomický časopis, pp. 426-447.
Jacob, M., Michaely, R. and Müller, M. A., 2017. Consumption Taxes and Corporate Investment. The Review of Financial Studies, pp. 1-39 [ CrossRef]
Koopmans, T., 1963. On the Concept of Optimal Economic Growth. Cowles Foundation for Research in Economics, Yale University.
Langenmayr, D., Haufler, A. and Bauer, C. J., 2015. Should tax policy favor high- or low-productivity firms? European Economic Review, 73(Supplement C), pp. 18-34 [ CrossRef]
Lee, Y. and Gordon, R. H., 2005. Tax structure and economic growth. J ournal of Public Economics, 89(5-6), pp. 1027-1043 [ CrossRef]
Ljungqvist, A. and Smolyansky, M., 2016. To Cut or Not to Cut? On the Impact of Corporate Taxes on Employment and Income. Massachussets: National Bureau of Economic Research.
Ljungqvist, A., Zhang, L. and Zuo, L., 2017. Sharing Risk with the Government: How Taxes Affect Corporate Risk Taking. Journal of Accounting Research, 55(3), pp. 669-707 [ CrossRef]
Mertens, K. and Ravn, M. O., 2012. Empirical Evidence on the Aggregate Effects of Anticipated and Unanticipated US Tax Policy Shocks. American Economic Journal: Economic Policy, 4(2), pp. 145-181 [ CrossRef]
Mountford, A. and Uhlig, H., 2009. What are the effects of fiscal policy shocks? Journal of Applied Econometrics, 24(6), pp. 960-992 [ CrossRef]
Mukherjee, A., Singh, M. and Žaldokas, A., 2017. Do corporate taxes hinder innovation? Journal of Financial Economics, 124(1), pp. 195-221 [ CrossRef]
Ramsey, F., 1928. A Mathematical Theory of Saving. The Economic Journal, 38(152), pp. 543-559 [ CrossRef]
Romer, C. D. and Romer, D. H., 2010. The Macroeconomic Effects of Tax Changes: Estimates Based on a New Measure of Fiscal Shocks. American Economic Review, 100(3), pp. 763-801 [ CrossRef]
Solow, R., 1956. A Contribution to the Theory of Economic Growth. The Quarterly Journal of Economics, 70(1), pp. 65-94 [ CrossRef]
Swan, T., 1956. Economic Growth and Capital Accumulation. Economic Record, 32(2), pp. 334-361 [ CrossRef]
Vergara, R., 2010. Taxation and private investment: evidence for Chile. Applied Economics, 42(6), pp. 717-725 [ CrossRef]
|


