|
|
|
Abstract
The public disclosure of medium-term fiscal plans – “fiscal guidance” – represents an increasingly important, yet understudied element of fiscal transparency frameworks. This article introduces a dataset that contains a large set of forecasts on fiscal and economic items issued by all European Union governments over the period 2001-2018. These forecasts are used to build an index of fiscal guidance transparency and to explore its main characteristics and correlates. The analysis reveals that governments are more transparent in their guidance on fiscal flows and macroeconomic aggregates than on liabilities, assets, and exogenous assumptions. In addition, transparency declines in the forecast horizon and in the strength of the governing coalition. Collectively, the results suggest that fiscal guidance transparency may be a sensitive area of policymaking that deserves scholarly attention. Possible uses of the measure of fiscal guidance transparency in research are discussed.
Keywords: fiscal transparency; forecasts; guidance;, Stability and Growth Pact; disclosure
JEL: E62, H68, H83
1 Introduction
An extensive literature has studied the important topic of government transparency, so much so that the word has become a “magic concept” in public sector research (Pollitt and Hupe,  2011). Once seen as a monolithic concept and a synonym of good governance, it is now generally acknowledged that transparency is a multifaceted and controversial construct (Alt, 2021). Accordingly, scholars have disaggregated the concept of transparency into smaller “domains” of research (Cucciniello, Porumbescu and Grimmelikhuijsen, 2017 ). Of these, the fiscal transparency domain has given rise to a vibrant and growing stream of studies reviewed in prior work (Alt, 2019; de Renzio and Wehner, 2017). 2011). Once seen as a monolithic concept and a synonym of good governance, it is now generally acknowledged that transparency is a multifaceted and controversial construct (Alt, 2021). Accordingly, scholars have disaggregated the concept of transparency into smaller “domains” of research (Cucciniello, Porumbescu and Grimmelikhuijsen, 2017 ). Of these, the fiscal transparency domain has given rise to a vibrant and growing stream of studies reviewed in prior work (Alt, 2019; de Renzio and Wehner, 2017).
This article contributes to fiscal transparency research by introducing an index that measures the extent to which governments are transparent in their “fiscal forward guidance” (Fujiwara and Waki, 2020) – or “fiscal guidance” for short. In the context of this article, fiscal guidance means the disclosure by governments of information that is restricted to politicians and bureaucrats until it is publicly released and that reflects expectations to, and plans for, the future fiscal and economic outlook. Such information – contained in fiscal plans and presented in the form of forecasts – should improve the information set of private agents insofar as it quantifies the likely effect of current and future policies on the economy and the budget, ultimately reducing information asymmetry and policy uncertainty.
Not surprisingly, the role of guidance in promoting fiscal transparency was recognized long ago: “transparency requires the provision of reliable information on the government’s fiscal policy intentions and forecasts” (Kopits and Craig, 1998: 1, emphasis added). Yet, empirical evidence does not presently exist about the extent to which governments are transparent in their fiscal guidance. The objective of this paper is to introduce a measure of fiscal guidance transparency for all the countries that were member states of the European Union (EU) in the period 2001-2018. The measure takes the form of a continuous index that ranks countries based on the quantity of forecasts that they issue in compliance with the reporting regime established by the Stability and Growth Pact (SGP). Since 1997, the SGP reporting regime imposes on EU governments the annual obligation to publish a fiscal plan containing numerical, point forecasts on fiscal stocks and flows, economic aggregates and exogenous assumptions (EU, 1997a; 1997b; 1997c). As fiscal plans published under the SGP are publicly available, these forecasts were retrieved and organized in a dataset usable by researchers. This dataset covers up to 28 EU countries and up to 18 country-year observations. It includes an estimated date (day/ month/year) in which the fiscal plan was first made public and numerical, point forecasts on up to 117 unique items ranging from the components of fiscal balance and economic growth to the drivers of stock-flow adjustments and exogenous assumptions with a forecast horizon of four years. Next, a longitudinal, country-level index of fiscal guidance transparency was created by comparing the number of items on which governments issued a forecast in each fiscal plan at each forecast horizon to the number that was recommended by the EU in each year. 1
Variation in the level of fiscal guidance transparency across countries is made possible by the unique features of the SGP reporting regime. In particular, the SGP mandates all EU governments to release a fiscal plan annually but requires that forecasts on only a few items – such as the fiscal balance and the level of Maastricht debt – be published. While guidance on the remaining items is recommended in the context of the SGP, the recommendation is not enforceable. As the evidence will show, the combination of mandatory disclosure of fiscal plans and voluntary disclosure of item-level forecasts gives rise to valuable cross-sectional and longitudinal variation in the fiscal guidance transparency index for the period under consideration. In particular, the evidence shows that countries are selective in their guidance. On average, guidance is relatively transparent concerning future macroeconomic aggregates – such as gross domestic product (GDP) and its components – and future fiscal flows – revenues, expenditures, and their components. In contrast, guidance is relatively opaque vis-à-vis the drivers of future changes in the level of government debt – such as privatization receipts and stock-flow adjustments – as well as in the assumptions underlying the fiscal plan. Whether selective transparency in fiscal guidance derives from an intention to withhold information or rather reflects uneven difficulty in forecasting individual items is an interesting and important question that future research may address using the fiscal guidance transparency index. In this paper, multivariate analysis will suggest that both drivers may play a role in determining the observed levels of transparency. On the one hand, the quantity of forecasts disclosed declines in the forecast horizon – supporting the notion that forecasting ability partly explains the levels of guidance transparency observed. On the other hand, transparency declines in the strength of the governing coalition and in the level of parliamentary fragmentation, while increasing in the level of democracy. These latter findings – which are consistent with earlier research (Cicatiello, De Simone and Gaeta, 2017; Citro, Cuadrado-Ballesteros and Bisogno, 2021) – indicate that the observed levels of fiscal guidance transparency may be affected by political interference too.
The forward-looking nature of the fiscal guidance transparency index complements other efforts to measure government openness about past fiscal outcomes and/or budgetary processes (Alt, Lassen and Wehner, 2014; Bastida and Benito, 2007; Hollyer, Rosendorff and Vreeland, 2014; IBP, 2017; Wang, Irwin, and Murata, 2015; Williams, 2015). Due to its unique forward-looking nature, the index lends itself to a variety of novel applications at the intersection of political economy, public finance and accounting, public administration, and political science. An important aspect of the dataset is that each fiscal guidance event is measured at an estimated day/month/year frequency. Accordingly, the data presented in this article can be matched with high frequency variables to examine causes and consequences of forward-looking fiscal disclosure choices. For example, the data can be used to study whether a relation exists between fiscal guidance transparency and changes in government and whether the average forecast horizon of fiscal plans depends on electoral pressures (Aaskoven, 2016). The data can also be used to study whether and how participants in financial markets react to fiscal plans upon their disclosure – a topic that is receiving increasing attention across disciplines (Alt, 2021; Mosley, Paniagua and Wibbels, 2020; Pástor and Veronesi, 2012). Finally, researchers can use the data presented in this article to study the causes and consequences of delay in the release of fiscal plans – which may reflect incumbents’ willingness to disclose or withhold information or alternatively, weak governance mechanisms and bottlenecks in the political process (Alt and Lowry, 1994; Andersen, Lassen and Nielsen, 2014; Edmonds et al., 2017).
The paper proceeds as follows. Section 2 argues that public fiscal guidance is an important and separate instrument of fiscal transparency frameworks and reviews extant approaches to measure fiscal transparency. Section 3 explains the steps taken to construct the dataset and presents evidence of its main characteristics. Section 4 presents the results of constructing the fiscal guidance transparency index, conducts descriptive analyses and presents the results of exploratory multivariate regressions. Section 5 briefly concludes.
2 Related literature
2.1 Expected benefits of fiscal transparency
The importance of fiscal transparency as a research topic cannot be overstated. Ever since the 1990s, fiscal transparency has been considered a pillar of good governance because it promotes government accountability by shedding light on the way in which politicians and bureaucrats allocate the resources entrusted to them by taxpayers, legislative assemblies and investors (Hood and Heald, 2006; IMF, 1998; OECD, 2002; World Bank, 1992). Research on fiscal transparency has evolved hand-in-hand with the growing adoption of transparency best-practices by policymakers. A considerable body of transparency literature now exists that spans multiple disciplines (see, e.g., Alt, 2019, 2021; Cucciniello, Porumbescu and Grimmelikhuijsen, 2017; de Renzio and Wehner, 2017; Khagram, de Renzio and Fung, 2013).
The benefits of fiscal transparency are generally predicated on two outcomes. On the one hand, transparency helps to hold the government accountable because the disclosure of fiscal information acts as a deterrent to the wasteful and opportunistic spending of revenues and the accumulation of private benefits and perquisites (Williams, 2015). Theoretically, the deterrent effect of transparency initiatives is inspired by agency-theory perspectives (Jensen and Meckling, 1976), as the ability to observe information about government operations induces an alignment between the actions taken by the government (the agent) and the interests of taxpayers, firms and investors (the principals) (Milesi-Ferretti, 2004). On the other hand, transparency may serve to provide information on which the public can act and that is private to the government until it is transparently disclosed. Under this perspective, transparency is beneficial insofar as citizens, civil servants, firms and market participants find fiscal information useful to make their own decisions on, e.g., allocating resources, making or withholding investments, and confirming or replacing the governing coalition (Alt, Lassen and Rose, 2006; Berliner, Bagozzi and Palmer-Rubin, 2018). It is noticeable that these two benefits of transparency – favouring ex-ante decision-making and promoting ex-post accountability – are explicitly recognized in the modern frameworks that govern the construction of public sector financial reports (IPSASB, 2014).
The two expected benefits of fiscal transparency are not novel, as they have been often discussed in relation to the extent to which governments are open about past fiscal outcomes and/or the budgeting processes (de Renzio and Wehner, 2017). What makes fiscal guidance transparency unique, however, is that information on the future fiscal and economic outlook is particularly timely. As fiscal guidance consists of in the disclosure of fiscal plans before the effect of policies materialize, transparent guidance allows the public to update their own expectations about future economic and fiscal conditions. Accordingly, fiscal guidance substantially enriches the information set of the public, while reducing information asymmetry vis-à-vis the government. The unique timeliness of fiscal guidance makes it a key instrument of fiscal transparency frameworks. For example, Alt, Lassen and Rose ( 2006: 31) emphasize that ideally, information provided by governments can only be considered transparent if it provides “voters, observers, financial markets, and sometimes politicians themselves with more information about the intentions behind fiscal policy, the actual actions taken, and the immediate and longer-term consequences of specific policies” (emphasis added). By its nature, fiscal guidance provides information on intentions and consequences, thus substantially easing “the task of forecasting future fiscal policy and of attributing fiscal outcomes to policies, and fiscal policies to particular politicians” (ibid.). Additionally, fiscal guidance provides a benchmark against which fiscal and economic outcomes can be compared, thus providing a clear benchmark against which to judge the government once outcomes materialize.
It is important to emphasize that arguments about the expected benefits of guidance assume that the audience acts according to expectations. By contrast, other instruments of fiscal transparency frameworks, such as the dissemination of comprehensive information on past policy outcomes, the quality of fiscal reports, or the degree of openness of the budgetary process promote fiscal transparency by improving the ability of the public to extract past signals from noise (Milesi-Ferretti, 2004). As prior research has primarily studied these alternative pillars, the next section reviews related measures of fiscal transparency.
2.2 Extant measures of fiscal transparency
Prior research has measured fiscal transparency primarily through one of two approaches: the “checklist” and the “missing-data” approach.
Papers adopting a checklist approach measure transparency as the extent to which fiscal/budgetary information follows desirable standards defined in the checklist. For example, the pioneering study by Alt, Lassen and Rose ( 2006) uses the checklist approach to evaluate the extent to which US state budgetary processes follow best practices on, e.g., reporting based on generally-accepted accounting principles, presence/absence of multi-year expenditure forecasts, and involvement of the legislature in the production of revenue forecasts, among others (Bastida and Benito, 2007; Benito and Bastida, 2009). The Open Budget Index (OBI) released on a biannual basis by the International Budget Partnership (IPB) extends the checklist approach and applies it to a large number of countries (IPB, 2017). Recently, Wang, Irwin and Murata ( 2015) adopted the checklist approach to rank governments based on the comprehensiveness of fiscal reports by examining the extent to which reporting on fiscal outcomes complies with IMF guidelines on the coverage of fiscal stocks and flows.
Papers adopting a missing-data approach measure transparency by comparing the amount of data that governments make available to the public against a benchmark typically set at a supranational level. The benchmark number of items that should be disclosed allows researchers to form an expectation of the “ideal” level of transparency against which observed levels are compared. Under the missing-data approach, the action of disclosing items increases transparency. Instead, the withholding of items that could have been published by governments decreases transparency. Hollyer, Rosendorff, and Vreeland ( 2011) use the missing-data approach by collecting the data that governments transmit to the World Bank as part of the World Development Indicators initiative. They measure transparency as the number of items that are shared by governments with the World Bank as a proportion of the total number of items that should have been disclosed, attributing greater transparency to governments that withhold comparatively fewer data.
Similarly, Williams ( 2015) computes the number of economic and financial datapoints that governments disseminate to international institutions and codes their presence or absence, thus equating high transparency with a large amount of published information (see also Hollyer, Rosendorff and Vreeland, 2014).
Methodologically, this paper follows the missing-data approach to measuring transparency. Specifically, the level of fiscal guidance transparency in the sample is measured as the extent to which EU governments publish forecasts on the items that are recommended in publicly available guidelines at the time of disclosure. In their most stringent form, these guidelines recommended the publication of 161 items, of which 117 are used to construct the dataset after repeated items and forecasts on items that are applicable only to specific countries or that have unique time horizons are eliminated. The next section elaborates on the steps followed to build the fiscal guidance transparency dataset and to derive the fiscal guidance transparency index.&
3 Construction of the fiscal guidance transparency dataset
3.1 Retrieving fiscal plans
Pursuant to articles 4 and 7 of Council Regulation (EC) 1466/97 of 7 July 1997 (EU, 1997a), EU governments must publish one fiscal plan every year. These plans are known as either “Stability” or “Convergence” Programmes (in short: SCPs), depending on whether the country adopts the euro as its currency. This unique reporting mandate allows the researcher to obtain access to all the SCP published by EU governments, which are publicly available in the EC online archives dedicated to the European Semester.2 The dataset is restricted to the SCPs published over the period 2001-2018 because it was only with the 2001 vintage that the EU published guidelines on the format and content of SCPs.3 In the dataset, each unique SCP is identified through the counter variable d_nr.
Table 1 reports the number of unique SCPs per country that are present in the dataset. Column 2 lists the number of unique SCPs issued by each member state. There is heterogeneity in this number for three reasons. First, while in the period 2001-2003 there were 15 member states of the EU, the number of member states increased over the years. Specifically, a first wave of EU enlargement took place in 2004, when 10 countries joined the EU. A second wave of enlargement took place in 2007 when Bulgaria joined the EU together with Romania. A final addition to the EU membership was Croatia in July 2013. As the obligation to submit SCPs only applies to EU member states, the number of country-specific observations partly depends on the date of EU accession, reported in column 5. 5 Second, governments have published additional SCPs beyond those required, on an occasional basis. Out of the 434 SCPs published between 2001 and 2018, 420 were regular SCPs and 14 were ad hoc publications as indicated in columns 3 and 4, respectively. The occasional publications increase the number of SCP observations for the related government. These publications are identified in the dataset through the variable d_regular, which takes value 0 if the SCP represents an occasional publication, and 1 otherwise.
Table 1Stability/Convergence Programmes (SCPs) by country DISPLAY Table
Table 2 lists the occasional publications, identified in the dataset by the variable d_status. Each of them was analysed in depth to understand their rationale. The analysis indicates that there were three occasional publications following a request by the Council that the government resubmits the SCP because inadequate or insufficient information was disclosed in the prior issuance. Whether the Council makes such request can be observed by retrieving the Council Opinion that closes the SGP cycle, which is public information. Four additional publications represent updates of the SCP published between December 2008 and February 2009 to incorporate the EU-wide strategy of fiscal expansion that followed the 2008 financial crisis. Six publications represent resubmissions of earlier SCPs issued by governments voluntarily, typically because of a change in the parliamentary majority or in the cabinet after an election. Finally, one occasional publication represents Portugal’s voluntary submissions of a fiscal plan in 2014 when the country was exempted from SCP disclosure because it was under a financial assistance program. This was an exception, however. Indeed, the third and final reason why there is heterogeneity in the number of SCPs across countries is that governments halt the publication of SCPs when they are under external financial assistance. This is the reason why the number of observations for Greece and Cyprus is lower than that of other countries that began publishing SCPs in the same year.
3.2 Estimating the publication date of fiscal plans
The second step of the data collection process involved estimating the dates on which each SCP was first made public by the government. Research on SCPs typically assumes a publication date at the year or quarter-year level, in line with the SGP requirements (Frankel and Schreger, 2013; Paredes, Pérez and Perez- Quiros, 2015). Yet, no study has previously assembled a dataset of these dates at the day/month/year level. Such an effort provides important benefits to researchers interested in working with daily data, while revealing that a considerable number of SCPs were not publicly disclosed when they were due.
To retrieve the publication dates, the relevant administration of each EU government was contacted by e-mail with a request for the day/month/year in which each SCP was publicly disclosed. While the relevant administration was typically the Ministry of Finance, the final source of information varied somewhat. 5 A total of 10 out of 28 governments responded, for a 35.7 percent response rate. Of these responses, six contained the information and one pointed to a webpage containing the information. The remaining three provided an incomplete answer. In the absence of a (complete) response, the administration was contacted by phone. Following this second round of requests, the publication dates were most often obtained by email. Alternatively, a web source was provided that clarified how the information could be retrieved. At the end of the process, which lasted approximately two months between March and May 2016, 21 out of 28 governments responded to the request for information, for a 75% positive response rate. Overall, the interaction with governments returned 176 SCPs associated with unique publication dates.
The second step involved a news search conducted using Thomson Reuters EIKON via the app “Newsroom”. Newsroom was interrogated for any piece of news containing the words “Stability Programme, Stability Program, Stability Report, Stability Plan” in a period starting on the first day of the month preceding the month of submission of the document to the EC and ending on the day of the Council Opin-ion. 6As will be explained below, the latter two sets of dates were retrieved from the EC online archives. The news search returned 209 articles that allow the precise dating of the first-time publication of the SCP. There are 73 cases in which both government sources and the press search resulted in a publication date. In 31 out of these 73 cases (42.4 percent), the publication date is exactly the same according to both the government and the press. On average, the government-provided publication date follows the press-estimated publication date by 1.47 days. The estimates from an intercept-only regression reported in column 1 of table 3 do not allow rejection of the hypothesis of this difference being zero. Thus, when the publication date was available either from the press or from both sources, the press-provided publication date was privileged. The government-provided date was used to replace missing cases when the press publication date was not available.
Table 3Differences in event dates DISPLAY Table
When neither the press nor the government provided a publication date, the missing dates were replaced with the day in which the government approved the SCP, denoted in the dataset with d_cabday. Information on cabinet-approval dates was either contained in the SCP itself or provided by governments. Once more, the regression results reported in column 2 of table 3 reveal that the difference between the cabinet approval date and the press publication date has a mean value of 0.66, not significantly different from zero. Therefore, the cabinet approval date was used to fill the publication date when this was missing. The data collection procedure was finalized by consulting EC online archives, and the date on which the government transmitted each SCP to the EC was retrieved. This date – denoted in the dataset with d_subday – may differ from both the cabinet approval and the publication date. Informal conversation with staff involved in the process indicated that governments typically submit the SCP to the EC about three days after the approval of the document by the cabinet. Column 3 of table 3 shows that the difference between the submission date and the press-provided publication date indeed returns a mean value of 3.09 days, which is statistically significant. The publication date was replaced with the submission date when neither the cabinet approval date nor the publication date was available.
The resulting variable d_day represents the best estimate of the publication date for the entire sample of SCPs. Researchers can use the other dates reported in the dataset for specific purposes. At the end of this second step, it was possible to assign a publication date to each of the 434 SCPs included in the dataset between 2001 and 2018. In the 8 cases in which the publication date fell on a weekend, it was attributed to the following Monday.
The dataset also includes the date on which the European Commission made its recommendation to the Council of the EU – denoted with d_recday – as well as the date on which the latter released its Opinion – denoted with d_opday. The first refers to the date contained in the EC recommendations. The second refers to the day the Council Opinion was first published in the Official Gazette of the European Union. These dates are both public information. The data indicate that on average, 32 days separate the EC recommendation from the Council Opinion date. In turn, the average difference between the EC recommendation date and the estimated publication date is 44 days. Hence, the whole SGP cycle runs for 76 days on average.
The availability of the submission date allows the construction of a measure of the number of days between the date of submission of the SCP to the EC and the deadline for the submission itself. This measure can be of interest to researchers because it may reflect incumbents’ willingness to disclose or withhold information or alter-natively, weak governance mechanisms (Andersen, Lassen and Nielsen, 2014; Edmonds et al., 2017). To construct this measure, a deadline must be attributed to each SCP submission. These deadlines are imposed by the EU and are public information. Between 2001 and 2010, they could be submitted to the EC any time between October 15 and December 1. Since 2011, SCPs have to be submitted by April 30. In addition, specific country-years had exceptional deadlines. For instance, exceptional deadlines were set for the 2008 and 2009 submissions, which could be sent to the EC by the end of December and the end of January, respectively (EU, 2008; 2009). In addition, the Eastern European governments that entered the EU in 2004 had their first submission deadline set on May 15, 2004. Until 2010, the governments of the UK and Ireland could submit their SCP by the time of the approval of the budget and pre-budget statements – usually discussed in Parliament by the first week of December. For the UK, these dates were retrieved from parliamentary sources (House of Commons Information Office, 2010; House of Commons Library, 2018). 7 For Ireland, information is available at the government-dedicated webpage. 8 Other “ad hoc” deadlines were established in a case in which the Council requested the resubmission of a non-compliant SCP. The variable d_deadline reflects each of these idiosyncrasies and it captures the SCP-specific deadline. A measure of delay can be calculated as the submission date less the deadline, which is available for 412 SCPs. Alternatively, using the publication date in place of the submission date makes a measure of delay available for 423 SCPs.
3.3 Organizing the dataset of fiscal plans
As noted earlier, SCPs are published approximately once a year, although late submissions and occasional publications may translate into an imbalance in the number of annual SCPs publications. This implies that in a given year, no SCP of a given country may be present in the dataset, or alternatively it may appear more than once. In other words, there may be a discrepancy between the expected year of publication – denoted in the dataset with d_expyear – and the actual publication year – d_year. The discrepancy prevents one from organizing SCP data using years as the time index as it would be characterized by either gaps or repeated observations. In addition, the forecasts that each SCP should contain based on EU recommendation have changed since the first vintage of SCPs was published in 1998. The content and format of presentation of SCPs have been periodically set in documents known as Guidelines on the format and content of Stability and Convergence Programmes, also known as Codes of Conduct (hereafter referred to as “CoC”) – endorsed following a proposal by ECOFIN9 As it will be explained in what follows, the SCP data are best organized using the changing CoC requirements as anchor.
Technically, the CoCs are considered a “complement” to the SGP (EU, 2005). Specifically, it is in the CoCs that one finds details on the items on which EU governments should issue a forecast. In line with Regulation 1466/97 (Article 3.2a), EU governments are subject to the obligation to issue a forecast on the budget balance and on government debt. 10 The regulation also imposes the publication of the “main assumptions about expected economic developments and important economic variables which are relevant to the realization of the stability programme such as government investment expenditure, real gross domestic product growth, employment and inflation” (Article 3.2b, emphasis added). 11 Note that, while the Regulation is clear as to the budgetary variables that should be included in the SCP reports and its provisions have legal force, the list of “main” and “important economic variables” to be reported is indicative. The CoC, therefore, serve to clarify the set of additional economic and financial information that governments should include in their annual SCP reports as well as their measurement basis, which is typically based on the European System of Accounts (ESA) concepts. In this sense, the CoCs represent “guidelines” on the content of SCPs. In turn, the CoCs also clarify the “format” for presenting the information. In what follows, both the format and the content are described, alongside an explanation of their use in giving structure to the dataset.
All CoCs were retrieved from the online archives of the EC. There have been eight CoCs issued since 1998. All CoCs – except for the 1998 ones – specify the tabular format to be used for the submission of SCPs. They further contain guidelines over the applicable measurement basis of economic and budgetary items, and the “required” vs. “optional” nature of each item. The first CoC, applicable to the submission between 1998 and 2000, did not contain disclosure requirements that are sufficiently unambiguous to generate a coherent list of items that were expected to be disclosed. Beginning with the second CoC, however, the class of items to be disclosed was harmonized and a list of required items was made explicit. Each iteration of the CoC slightly modified the recommended set of items on which a forecast should be made. At the date of writing, the applicable CoC has reached its eighth iteration, approved in May 2017. In the dataset, each CoC iteration is indexed by the counter variable d_coc.
Because EU sources include the date on which each CoC was endorsed by the Council, it is possible to match the disclosure requirements of each SCP with the date of publication estimated in the previous sub-section. It is, therefore, possible to use the format introduced in each CoC as a template that sets out the expected format and content of each SCP at any specific date. Crucially, this strategy ensures that two SCPs published in the same year are organized according to two different CoCs if a new CoC was endorsed in the meanwhile.
This strategy is used to give structure to the data collection process. First, a spreadsheet was built that contain as many worksheets as the number of years of SCP submissions ranging from 2001 to 2018. Because information is disclosed in each SCP of year t at the horizons t-1, t, t+1, t+2, and t+3, plus information on t-1 levels (for a limited set of items), each of the worksheets contains up to six observations per country and as many countries as there were member states of the EU in year t. Each column contains one item that was recommended for publication in line with the CoC applicable at the SCP disclosure date. For this reason, the number of columns changes across worksheets in line with the number of items required by the different CoC iterations over the 2001-2018 period.
In the dataset, each item is attributed a name that resembles the item name under the ESA nomenclature. A number always precedes variable names, which refers to the number of the relevant table according to the applicable CoC. For example, real GDP growth rates are typically found in table 1 and are coded as t1_realgr, while the general government budget balance is found in table 2 and is coded as t2_netlendggov, etc. 12In turn, each cell contains one numerical value that reflects the forecast for that item as disclosed in the related SCP. If the forecast is missing, the cell is set to missing. With this procedure, if an item is disclosed, say, for forecast horizon t, t+1 and t+2, but not t+3, the cells that correspond to that item in t, t+1 and t+2 receive a numerical value, while the cell in t+3 is set to missing. In this way, the dataset preserves within-country-SCP variation in the number of forecasts issued at different forecast horizons. A dataset containing the original, numerical forecasts accompanies the dataset recording their presence/absence. Forecast horizons are captured by a discrete variable denoted with f_hor that takes value 0 in year t and value 4 in year t+3. The variable f_year records the year to which the forecast refers.
The inclusion of data points in the final dataset required some judgment. First, when a government has a fiscal year that differs from the calendar year and reports forecasts as referring to, say the t/t+1 period, that forecast was attributed to year t if the fiscal year ends before June 30. Second, when forecasts are presented as ranges, approximate values, or as average of multiple horizons, the corresponding values were noted in the dataset and coded to missing afterwards. The rationale is that no CoC allows publishing range or approximate forecasts, nor does it allow for the collapsing of information that pertains to multiple forecast horizons. When items are reported as the sum of multiple items, they are coded as missing because the CoC does not allow collapsing across items. When a forecast is presented as referring to an item indicated in the related CoC, but the government specifies that its value refers to an item not included in the CoC, the cell is set to missing. Also, when the CoC allows the same item (say, government revenue) to be presented multiple times in the SCP, the data points are coded as not missing if the item is present at least once, to avoid double-counting. This procedure applies only when the CoC explicitly states that the item code refers to the same measure in all the tables where it appears. The “item code” is the official ESA code. When items are reported outside of the table in which they should be presented, their values count as not missing. In addition, values that are not reported although they would have been equal to zero had they been reported, are set to missing. Finally, to guarantee uniformity within the dataset, all items reported for years t-1 are recorded but not included in the final dataset because they do not represent forecasts.
Three categories of items were excluded from the data collection process. These are “Government Expenditure by Function”, which only contain data points related to years t-2 and t+3, and “Long-Term Projections” which contain forecasts for decades ahead. Also, forecasts included in the table titled “Comparison with Prior Update” were excluded from the final dataset because they relate to forecasts for real GDP growth, the debt and the budget balance already present in other tables. One additional item was excluded – the budget balance of state governments – because it only applies to countries with a federalist structure and may thus over- or under-estimate the level of transparency of these countries. For the same reason, items were excluded that were required only for a limited set of governments.
The resulting complete dataset contains 434 unique SCPs and 1,674 observations, for a final number of 195,858 data-points disclosed by up to 28 countries and that relate to 117 unique items, with a forecast horizon of up to 4 years.
4 Evidence
4.1 Distribution of fiscal guidance disclosure dates
Table 4 reports the distribution of the full sample of fiscal plans by year, quarter, month, and day of the week. The table shows substantial heterogeneity in the disclosure dates. This heterogeneity partly reflects some institutional idiosyncrasies of the SGP process that are important to consider when using the dataset in empirical work.
The increase in the number of fiscal plans registered in 2004 and 2007 is due to the enlargement of EU membership to several Eastern European nations, which was accompanied by two SCP reports, one published in spring and the other in autumn 13In 2010, SCP submissions were suspended as part of a reform to the SGP monitoring cycle known as the “European Semester”. Yet, the table reports 25 SCPs published in 2010. This is due to the fact that most governments published in early 2010 those SCPs that belonged to the 2009 cycle, for which the EU authorized the exceptional deadline of January 31, 2010 (EU, 2009). 14 Also, between 2012 and 2018, Greece did not publish its SCP because it underwent a financial assistance program characterized by separate disclosure requirements. Cyprus was subject to the same exemption in the years 2013-2015; hence, the number of observations in those years declines. In terms of distribution of SCP by quarters, publication dates are clustered in the second and fourth quarter. This is to be expected because unless explicit exceptions were granted to governments, SCPs had to be submitted between October 15 and December 1 in the 2001-2009 period. Accordingly, the large number of submissions in the first quarter of the year partly reflects late publications taking place in January. From 2011 onwards, the deadline was moved to April 30 to align SCP submissions with the European Semester. The monthly breakdown of observations reflects these idiosyncrasies. Note that the somewhat large number of observations in the month of May is primarily due to the year 2004, when the first SCP of the new EU member states was to be submitted. In terms of weekdays, the publication of SCPs appears to be relatively uniform, with a somewhat larger number of SCPs published on Wednesdays and Thursdays.
Table 4Distribution of fiscal plans by publication year, quarter, month, and day DISPLAY Table
4.2 Items included in the dataset
Table 5 reports summary statistics of each item included in the dataset. The first column indicates the category in which each item falls based on the coding. This categorization broadly follows the structure of SCPs indicated by the CoCs published over the years. However, it departs from it in the coding of forecasts on cyclically-adjusted and structural components of the fiscal and economic outlook – such as the structural balance and the components of potential output growth. In this case, the forecast was categorized under the heading that reflects the variable that is being expressed after cyclical or structural adjustment. For example, the potential GDP is categorized within the forecasts of the “Economic outlook”, while the cyclical unemployment benefits fall within the “Fiscal outlook” category.
Table 5Summary statistics of items included in the dataset DISPLAY Table
4.3 Constructing the fiscal guidance transparency index
The data in the final dataset appear in the form of a nested, unbalanced panel sorted by country, publication day and forecast horizon. Each country c appears in the dataset on as many days d as a SCP was published, and four times – one for each forecast horizon k = 0, ..., 3. Each item i indicated in the previous table is, therefore, indexed by ic,k,d and nested within unique country-day pairs. There are R items recommended by the CoC that was applicable to SCPs published on the day d, with R increasing over time. Against this benchmark number, each item appears in the dataset as either missing or present, noted by 0 and 1, respectively. Therefore, i ∈ (0,1), and an intuitive measure of fiscal guidance transparency is: 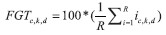 | (1) |
With FGT denoting the “fiscal guidance transparency” index. The FGT index rewards governments that publish a number of forecasts close to that recommended by the applicable CoC, denoted with R. The granularity of the measure is evident by the subscripts in equation (1). These remind the user that FGT takes unique values for each country-day-forecast horizon triad. This feature allows researchers to compute several alternative measures of transparency in the disclosure of government forecasts. For example, researchers could measure fiscal guidance transparency at specific forecast horizons of interests. Alternatively, researchers could construct measures of transparency on specific group of variables, such as components of stock-flow adjustment, depending on the research question. As recommended in recent work (de Renzio and Wehner, 2017) and in line with prior research (e.g., Wang, Irwin, and Murata, 2015), it is also intuitive to build a series of sub-indices of FGT that aggregate forecasts by the categories shown in table 5. To exemplify this particular use of the index, FGT is here constructed by separating the forecasts on the economic, fiscal, debt and assumption outlook by computing ![]() for forecasts belonging to each category.
Figure 1, panel A shows the ranking of FGT by country, while Panel B shows the evolution of the FGT index over the sample years. The country rankings may appear surprising at first, given the relative position of some large economies at the bottom of the table. While no attempt has been made to evaluate the degree to which the FGT index overlaps with alternative transparency measures, some comments can be made based on the data collection process. In particular, the low transparency score on the UK does not necessarily reflect a scarcity of data in the Convergence Programme that the country has published over the years. Rather, the score is explained by the fact that the Convergence Programme of the UK has, for many of the initial years of the SGP framework, reported most forecasts using definitions and measurement criteria inconsistent with those required by the applicable CoC. Indeed, it was not uncommon for the UK to publish only the Maastricht debt and deficit required under Regulation 1466/97, while not disclosing the ESA-compliant breakdown of these figures. As a result, many UK Convergence Programmes are characterized by limited FGT scores. The case of Germany – also a relatively low scorer – is somewhat different. In the case of Germany, in many years the government chose to publish forecasts on several prominent items in the form of averages that cover multiple forecast horizons. Accordingly, while an average forecast often existed for the entire period t-t+3, it was counted as missing when constructing the FGT index because the averaging of annual, point forecasts is forbidden under the CoC as it leads to a loss of information from the point of view of users (see section 3.3).
Apart from these idiosyncratic considerations, the relative FGT ranking of countries may suggest that there are some structural dynamics at play that do not characterize alternative measures of fiscal transparency. In particular, the ranking appears to vindicate the view that being open about the future fiscal and economic outlook reflects a unique transparency phenomenon from the point of view of the government. The next section presents an exploratory analysis of the FGT index to gain some insights on this intuition.
Figure 1Features of the fiscal guidance transparency index (FGT index) DISPLAY Figure
4.4 Analysis of the fiscal guidance transparency index
Table 6 reports summary statistics of the FGT index and of the four sub-indices. The overall FGT index score is 78, meaning that on average, 78 percent of the items recommended by the applicable CoC are disclosed by governments in their SCPs. The percentage is driven upwards by the relatively high level of transparency on items related to the expected economic and fiscal outlook – both disclosed more than 85 percent of the times. In turn, the percentage is driven downwards by the relatively low level of transparency on the debt outlook and on assumptions – reported 55 and 62 percent of the times, respectively. The latter two categories of forecasts are not only reported relatively seldom, but also with significant variability. In the sample, transparency on the debt outlook exhibits a standard deviation of 25, compared to an average standard deviation of 16. The variability is strikingly high when it comes to the disclosure of assumptions, which exceeds two times the standard deviation of the FGT score. As shown in table 5, forecasts on items such as government surplus/deficit, the level of government debt, and the rate of economic growth are virtually always disclosed in SCPs. On the contrary, the evidence indicates substantial underreporting of forecasts for items related to the fiscal position of the government. For example, governments publish forecasts on the future evolution of guarantees only 10 percent of the time, and only 7 percent of the time do they explicitly identify which amount covered the needs of financial institutions. It is also interesting to note that governments almost always (89 percent of the times) report the discrepancy between change in debt and the deficit – known as the debt-deficit or “stock-flow” adjustment (SFA). As the SFA is considered a way to hide the “true” fiscal picture (Alt, Lassen and Wehner, 2014), it may be promising to see that governments frequently issue guidance on it. Yet, the individual components of the SFA are systematically under-reported. For example, the contribution of privatization receipts, the reconciliation between cash and accrual, the acquisition of financial assets, and valuation effects are reported only 30 percent of the times.
Table 6Summary statistics of the fiscal guidance transparency index DISPLAY Table
Next, table 7 examines if the FGT index varies depending on the forecast horizon. Panel A reports the value of FGT at each forecast horizon k. There is an evident, monotonic decrease in transparency as the forecast horizon lengthens – from 80 to 76 percent. That is, countries are more likely to issue short-term rather than medium-term forecasts. This is accompanied by a monotonic increase in the variability around the mean from 14 to 18 percent. In panel B, the descriptive evidence is confirmed through an OLS regression of FGT on an indicator variable capturing the forecast horizon. In the OLS specification, a full set of country and year fixed effects is included, and standard errors are clustered two-way at the country-date level. Country and year fixed effects are included to control for unobserved heterogeneity and common shocks affecting the ability (and willingness) to issue forecasts at different horizons. Two-way clustering at the country-date level is advisable because FGT is nested within unique country-date pairs (Angrist and Pischke, 2009). All forecast horizon indicators have a negative coefficient that is significant at conventional levels, which confirms that fiscal guidance transparency is approximately 4 percentage points lower for medium-term than for short-term forecasts. This fact is interesting and somewhat worrisome given that the SGP mandate aims at increasing transparency over the medium-term outlook. It may be a sign that governments find that issuing SCP forecasts is consequential and that at least some countries prefer to avoid publishing fiscal and economic plans with a medium-term horizon as these may overly commit the government to a rigid course of action (Laffont and Tirole, 1992). Alternatively, it may reflect the relatively difficulty of acquiring precise medium-term compared to short-term information.
Table 7Transparency declines as the forecast horizon lengthens DISPLAY Table
Next, the main correlates of the FGT index are explored. In line with prior literature, the dependent variable is modelled as a function of economic, fiscal and political determinants (Khagram, de Renzio and Fung, 2013). Specifically, the model builds on three recent articles that use panel data to examine if government
transparency is endogenous to governments’ incentives (Berliner, 2014; Cicatiello, De Simone and Gaeta, 2017; Hollyer, Rosendorff and Vreeland, 2011). OLS is used to estimate: FGTc,k,d = αc+hk+tt+Government Strengthc,t+Fragmentation of Parliamentc,t+
Electoral Pressurec,t+Democracyc,t-1+GDP per capitac,t-1+Debtc,t-1+ Budget Balancec,t-1+Tradec,t-1+EU Fundsc,t-1+Euro Adopterc,t-1+εc,k,d
| (2) |
The model also includes economic and financial conditions. GDP per capita is included because the level of economic development should affect both the capacity of governments to collect and disseminate data, while reflecting citizens’ demand for information (Berliner, 2014; Cicatiello, De Simone and Gaeta, 2017; Hollyer, Rosendorff and Vreeland, 2011; Khagram, de Renzio and Fung, 2013). GDP per capita is measured as gross domestic product per capita at constant 2010 US dollars as reported by the World Bank. Debt and Budget Balance are the level of the general government gross debt and deficit as percentage of GDP as reported by Eurostat. These are included for two reasons. First, debt and deficit are the two indicators on which governments’ compliance with SGP fiscal rules is evaluated. Second, prior literature finds inconsistent results on the relation between governments’ financial conditions and transparency. For instance, Alt, Lassen and Rose ( 2006) report a negative effect of debt, and a positive effect of both surpluses and deficits on the level of transparency in the budgetary process of U.S. states. However, other studies do not find such a clear effect of financial conditions on transparency (Ríos, Bastida and Benito, 2016). Others exclude these variables from their models (Berliner, 2014; Wehner and de Renzio, 2013).
Trade – the sum of exports and imports divided by nominal GDP – is also included and is obtained through Eurostat. EU Funds – the annual amount of funds disbursed by the EU to the country divided by nominal GDP – is sourced from the EC. These variables capture the dependence of the country on external funding, which should correlate positively with transparency (Berliner, 2014; Khagram, de Renzio and Fung, 2013). Finally, a Euro Adopter binary indicator is added to denote members of the euro area that face relatively more stringent SGP requirements (Frankel and Schreger, 2013). The euro indicator switches on in country-years in which the country is a euro member. Dates of entry into the euro area are retrieved from the European Central Bank. All variables are lagged by one year, with the exception of the DPI measures that are measured as of January 1 st of year t in the original dataset (Berliner, 2014). Table 8 describes the variables and their sources. It should be noted that the model excludes measures of institutional and cultural aspects of the country environment which may explain observed transparency levels (Khagram, de Renzio and Fung, 2013). Yet, the inclusion of country fixed effects absorbs any of these time-invariant effects. Table 9 presents pairwise correlations between all variables.
Table 8Description and source of variables DISPLAY Table Table 9Pairwise correlations DISPLAY Table
Table 10 reports the results of estimating model (2). The five variations of the model report estimated coefficients without and with country fixed effects in columns 1/3 and 2/4, respectively. In columns 1 and 2, errors are clustered only on the country dimension, while in the remaining columns they are clustered two-ways at the country-date level. The estimates indicate that fiscal guidance transparency is largely a function of political dynamics at the time of disclosure. At the same time, time-invariant, country-specific characteristics should be controlled for in order to derive appropriate inferences. In particular, the percentage of seats held by parties supporting the government is negatively associated with transparency, but the coefficient is inflated when country indicators are not estimated. In addition, the effect sign of parliamentary fragmentation depends on the estimation of country parameters. Whereas fragmentation has a weakly positive association with FGT when fixed effects are not estimated, the association turns negative once fixed effects are included. The estimated coefficient suggests that for any percentage point increase in the probability that members of parliament belong to different parties, transparency declines by about a little more than a third of a percentage point. As the legislative chamber becomes more fragmented, its ability to demand information from governments declines substantially. This finding is similar both in sign and in magnitude to that reported by Cicatiello, De Simone and Gaeta ( 2017) who implement a similar panel specification. However, it differs markedly from earlier, cross-sectional findings (Alt and Lassen, 2006; Wehner and de Renzio, 2013). Also, a weakly positive effect of electoral pressure on transparency is recorded. As elections approach, governments increase transparency by about half a percentage point.
Finally, a strong and positive effect of Democracy on FGT is documented. This finding agrees with earlier evidence by Hollyer, Rosendorff and Vreeland ( 2011), seemingly suggesting that the drivers of transparency in the dissemination of information on economic and fiscal outcomes somewhat overlap with the drivers of transparency in guidance. While the evidence is consistent with prior work, it is notable that it is replicated in this sample of EU countries. Turning to the remaining variables, their effect is generally not significant. A negative association is reported between GDP per capita and FGT, but the effect is not robust to the inclusion of fixed effects. Similarly, there is a positive effect of Debt and Budget Balance, but only when time-invariant heterogeneity is not controlled for.
Table 10Fiscal guidance transparency (FGT) depends on political dynamics DISPLAY Table
5 Conclusion
This paper has introduced a novel dataset that contains the full set of economic and fiscal forecasts that EU governments disclosed over the period 2001-2018 in compliance with the requirements of the SGP fiscal reporting regime. The dataset is structured as an unbalanced panel of 434 fiscal plans that contain forecasts released by up to 28 countries on up to 117 unique items over a forecast horizon of up to 4 years. It is the first dataset to be solely dedicated to measuring the quantity of forecasts disclosed by EU governments over a large number of years. The dataset has important benefits from the point of view of researchers. It is amenable to cross-sectional, time-series applications, complementing other efforts in this direction (Cicatiello, De Simone and Gaeta, 2017; Wang, Irwin and Murata, 2015). It also presents important sources of variation at theoretically-salient dimensions – e.g., whether short- or medium-term forecasts are released and the extent to which transparency differs across kinds of forecasts – economic or fiscal. Finally, the dataset contains estimates of the precise dates – day/month/year – at which fiscal plans were first disclosed to the public. These dates can be easily matched with data on, e.g., key political cycle dates or financial market movements.
In this article, the dataset was used to measure the degree of transparency of government fiscal guidance. Fiscal guidance refers to the public disclosure of information that is restricted to the government until it is disclosed and that informs the public about the expected (by the government) evolution of future fiscal and economic aggregates (Fujiwara and Waki, 2020). In this paper, a measure of fiscal guidance transparency (the FGT index) was proposed that compares the quantity of items on which a government issues a forecast at a given forecast horizon to the quantity that was recommended in the SGP reporting guidelines in force at the time of disclosure. The evidence indicates that fiscal guidance transparency is relatively high – at 85 percent on average. However, this average value hides substantial heterogeneity across countries, years, forecast horizon and category. In particular, the analysis presented in this paper indicates that guidance on sensitive items – such as forecasts on the drivers of stock-flow adjustments – is generally withheld by governments. In addition, the FGT index correlates negatively with the forecast horizon, signalling that governments are comparatively less able – or less willing – to share their medium-term expectations with the public. Finally, the evidence shows that country-year variation in the FGT index is largely a function of contemporaneous political dynamics. Most notably, fiscal guidance transparency declines when governments possess a strong majority of seats in parliament and when the parliament is fragmented. Importantly, the results indicate that democracy positively correlates with fiscal guidance transparency. Future research may explore the robustness of these results and identify the mechanisms that make governments more or less willing and able to be open about their economic and fiscal plans.
In closing, three caveats are in order. First, in line with prior research using a “missing-data” approach, transparency is operationalized in this paper as the quantity of information that governments make available to the public (Hollyer, Rosendorff and Vreeland, 2014; Williams, 2015). This approach has the benefit of objectively identifying the extent to which governments choose to – or are able to – share their private expectations with the public. In the context of fiscal guidance, the primary drawback of this approach is that no attempt is made to measure the quality of forecasts by measuring, e.g., their ex-post accuracy. A second limitation of the fiscal guidance transparency measure and underlying dataset is its EU focus. This focus derives from the fact that the SGP reporting regime generates a benchmark for measuring fiscal guidance transparency in EU countries but not elsewhere. While the EU character of the FGT index certainly limits its use in comparative work, recent contributions underline that a relatively narrow institutional focus may actually promote a relatively more meaningful interpretation of results, thus promoting internal validity at the expense of external generalizability (Alt, 2019; de Renzio and Wehner, 2017). Indeed, the detailed explanation of the data collection process aimed at sensitizing the reader about the importance of duly considering the details of the institutional process that accompanied the evolution of the SGP reporting mandate over the years. A third limitation of the dataset introduced in this paper is that it only includes the forecasts contained in the Stability/Convergence Programmes released in compliance with the SGP requirements. Naturally, these are not the only forecasts that EU governments publish during the year. Indeed, it may be interesting to compare the forecasts introduced in the dataset to, e.g., those issued as part of the Excessive Deficit Procedure (Merola and Pérez, 2013).
Provided that these limitations are acknowledged, the dataset represents an important addition to research on fiscal transparency as it allows researchers to analyse the causes and consequences of transparency in fiscal guidance – an important, yet understudied pillar of advanced fiscal transparency frameworks. The dataset presents several attractive features. First, similar to a recent dataset – focused, however, on the reporting of past fiscal outcomes (Wang, Irwin, and Murata, 2015) – it contains a panel of multiple countries followed over multiple years. Second, the dataset presents country-level forecasts on a large number of unique, disaggregated items ranging from the components of fiscal balance and economic growth to the components of stock-flow adjustments and exogenous assumptions. This feature gives researchers considerable flexibility in studying the causes and consequences of specific phenomena that fall within the broader concepts of fiscal guidance transparency. Third, the dataset contains forecasts on each item at forecast horizons of up to four years. This feature allows studying the conditions that make governments more or less prone to commit to a medium-term as opposed to a short-term fiscal plan depending on the stage of the political budget cycle. Fourth, the dataset contains a publication date of SCPs estimated at the day/ month/year level, which allows researchers to match the dataset with data on post-disclosure financial market trends, election outcomes and investment decisions (Aaskoven, 2016; Arbatli and Escolano, 2015; Bastida, Guillamón and Benito, 2017; Benito, Guillamón and Bastida, 2016; Glennerster and Shin, 2008; Gulen and Ion, 2016). These are only examples, and other uses of the dataset and the FGT index are likely to arise as research on fiscal guidance transparency matures. Scholars are encouraged to use the fiscal guidance transparency dataset and the FGT index to study the effectiveness, desirability, and (unintended) consequences of government transparency on fiscal and economic outcomes that have yet to materialize – a distinct and possibly subtle form of transparency.
Notes
* I wrote this paper while visiting the University of Essex. I am thankful to Lasse Aaskoven, Ileana Steccolini, Marco Trombetta, two anonymous referees, and to 2021 Public Sector Economics Conference participants for valuable feedback on earlier drafts. I am also grateful to the civil servants of many European Union governments for assistance in retrieving portions of the data used in this paper. I am solely responsible for any errors and omissions.
1 The dataset is available at the journal website.
2 As of the date of writing, all SCPs published between 1998 and 2015 are available here. The remaining SCPs and the CoC are retrievable here (last accessed: 30 April 2019). After triangulating this search with government-provided information as described below, two additional SCPs were estimated to have been submitted in February 2000 by France and Germany. These SCPs could not be retrieved. In addition, there were six addenda to SCPs published by governments following the European Recovery Programme of 2008, which contained no new forecasts, however, and were, therefore, excluded from the dataset.
3 This issue is returned to below.
4 The accession dates were retrieved from European Commission (2019).
5 When collecting these publication dates, the SCPs published in the period 1998-2000 were included, too. The numbers reported throughout refer only to the SCPs included in the final dataset.
6 The word “Stability” was replaced with “Convergence” when the country was not a euro adopter.
7 The 2018 date of the Spring budget was retrieved from Gov.uk (2018).
8 See Gov.ie (2010).
9 The ECOFIN is the forum where the heads of the Ministries of Finance of the EU member states are represented.
10 The budget balance is known in the Government Finance Statistics Manual as the “net lending/net borrowing”
of the general government and it is expressed in percentage of gross domestic product at market prices.
The debt ratio is obtained by dividing the total amount of loans and bonds outstanding in the year by gross
domestic product at market prices. See IMF (2014, chapter 4). In the EU, these variables include some specific
items as determined by Eurostat and are known informally as the “Maastricht” debt and deficit ratios. See
Savage (2005) for a detailed discussion of the accounting treatment of fiscal figures under the SGP.
11 Article 7 applies these requirements to Convergence Programmes issued by governments of countries not adopting the euro as their currency.
12 The only exception is that for the years 2001-2005, where tables 3, 4, and 5 are renumbered to 4, 5, and 6, respectively, to allow comparison with later submissions of the SCP. This is because beginning in Stage 3, the third table of the CoC includes “Government expenditure by function”, which is excluded from the data collection (see above).
13 See the factsheet at European Commission (2019).
14 In 2008, the deadline for submission of SCPs was moved to December 31. See European Commission (2008).
* I wrote this paper while visiting the University of Essex. I am thankful to Lasse Aaskoven, Ileana Steccolini, Marco Trombetta, two anonymous referees, and to 2021 Public Sector Economics Conference participants for valuable feedback on earlier drafts. I am also grateful to the civil servants of many European Union governments for assistance in retrieving portions of the data used in this paper. I am solely responsible for any errors and omissions.
2 As of the date of writing, all SCPs published between 1998 and 2015 are available here. The remaining SCPs and the CoC are retrievable here (last accessed: 30 April 2019). After triangulating this search with government-provided information as described below, two additional SCPs were estimated to have been submitted in February 2000 by France and Germany. These SCPs could not be retrieved. In addition, there were six addenda to SCPs published by governments following the European Recovery Programme of 2008, which contained no new forecasts, however, and were, therefore, excluded from the dataset.
3 This issue is returned to below.
4 The accession dates were retrieved from European Commission ( 2019).
5 When collecting these publication dates, the SCPs published in the period 1998-2000 were included, too. The numbers reported throughout refer only to the SCPs included in the final dataset.
6 The word “Stability” was replaced with “Convergence” when the country was not a euro adopter.
7 The 2018 date of the Spring budget was retrieved from Gov.uk ( 2018).
8 See Gov.ie ( 2010).
9 The ECOFIN is the forum where the heads of the Ministries of Finance of the EU member states are represented.
10 The budget balance is known in the Government Finance Statistics Manual as the “net lending/net borrowing”
of the general government and it is expressed in percentage of gross domestic product at market prices.
The debt ratio is obtained by dividing the total amount of loans and bonds outstanding in the year by gross
domestic product at market prices. See IMF ( 2014, chapter 4). In the EU, these variables include some specific
items as determined by Eurostat and are known informally as the “Maastricht” debt and deficit ratios. See
Savage ( 2005) for a detailed discussion of the accounting treatment of fiscal figures under the SGP.
11 Article 7 applies these requirements to Convergence Programmes issued by governments of countries not adopting the euro as their currency.
12 The only exception is that for the years 2001-2005, where tables 3, 4, and 5 are renumbered to 4, 5, and 6, respectively, to allow comparison with later submissions of the SCP. This is because beginning in Stage 3, the third table of the CoC includes “Government expenditure by function”, which is excluded from the data collection (see above).
13 See the factsheet at European Commission ( 2019).
14 In 2008, the deadline for submission of SCPs was moved to December 31. See European Commission ( 2008).
Disclosure statement
There are no conflicts of interest to disclose.
References
Aaskoven, L, 2016. Fiscal transparency, elections and public employment: Evidence from the OECD. Economics & Politics, 28(3), pp. 317-341 [ CrossRef]
Alt, J. E. and Lassen, D. D., 2006. Fiscal transparency, political parties, and debt in OECD countries. European Economic Review, 50, pp. 1403-1439 [ CrossRef]
Alt, J. E. and Lowry, R. C., 1994. Divided Government, Fiscal Institutions, and Budget Deficits: Evidence from the States. American Political Science Review, 88(4), pp. 811-828 [ CrossRef]
Alt, J. E., 2019. Twenty years of transparency research. Public Sector Economics, 43(1), pp. 5-13 [ CrossRef]
Alt, J. E., 2021. Keynote presentation on “Effects of fiscal transparency, participation and accountability on macro-fiscal, resource allocation, service delivery, governance, and development outcomes.” In: Public Sector Economics Conference 2021. Zagreb: Institute of Public Finance.
Alt, J. E., Lassen, D. D. and Wehner, J., 2014. It isn’t just about Greece: Domestic politics, transparency and fiscal gimmickry in Europe. British Journal of Political Science, 44(4), pp. 707-716 [ CrossRef]
Andersen, A. L., Lassen, D. D. and Nielsen, L. H. W., 2014. The impact of late budgets on state government borrowing costs. Journal of Public Economics, 109, pp. 27-35 [ CrossRef]
Angrist, J. D. and Pischke, J.-S., 2009. Mostly Harmless Econometrics : An Empiricist’s Companion. Princeton, NJ: Princeton University Press [ CrossRef]
Arbatli, E. and Escolano, J., 2015. Fiscal Transparency, Fiscal Performance and Credit Ratings. Fiscal Studies, 36(2), pp. 237-270 [ CrossRef]
Bastida, F. and Benito, B., 2007. Central Government Budget Practices and Transparency: An International Comparison. Public Administration, 85(3), pp. 667-716 [ CrossRef]
Bastida, F., Guillamón, M. D. and Benito, B., 2017. Fiscal transparency and the cost of sovereign debt. International Review of Administrative Sciences, 83(1), pp. 106-128 [ CrossRef]
Benito, B. and Bastida, F., 2009. Budget Transparency, Fiscal Performance, and Political Turnout: An International Approach. Public Administration Review, 69(3), pp. 403-417 [ CrossRef]
Benito, B., Guillamón, M. D. and Bastida, F., 2016. The Impact of Transparency on the Cost of Sovereign Debt in Times of Economic Crisis. Financial Accountability & Management, 32(3), pp. 309-334 [ CrossRef]
Berliner, D., 2014. The political origins of transparency. Journal of Politics, 76(2), pp. 479-491 [ CrossRef]
Berliner, D., Bagozzi, B. E. and Palmer-Rubin, B., 2018. What information do citizens want? Evidence from one million information requests in Mexico. World Development, 109, pp. 222-235 [ CrossRef]
Cicatiello, L., De Simone, E. and Gaeta, G. L., 2017. Political determinants of fiscal transparency: a panel data empirical investigation. Economics of Governance, 18(4), pp. 315-336 [ CrossRef]
Citro, F., Cuadrado-Ballesteros, B. and Bisogno, M., 2021. Explaining budget transparency through political factors. International Review of Administrative Sciences, 87(1), pp. 115-134 [ CrossRef]
Cucciniello, M., Porumbescu, G. A. and Grimmelikhuijsen, S., 2017. 25 Years of Transparency Research: Evidence and Future Directions. Public Administration Review, 77(1), pp. 32.44 [ CrossRef]
De Renzio, P. and Wehner, J., 2017. The Impacts of Fiscal Openness. The World Bank Research Observer, 32(2), pp. 185-210 [ CrossRef]
Edmonds, C. T. [et al.], 2017. Does timeliness of financial information matter in the governmental sector? Journal of Accounting and Public Policy, 36(2), pp. 163-176 [ CrossRef]
EU, 1997a. Council Regulation (EC) No 1466/97 of 7 July 1997 on the strengthening of the surveillance of budgetary positions and the surveillance and coordination of economic policies. Official Journal of the European Communities, 2.8.97 L 209/1.
EU, 1997b. Council Regulation (EC) No 1467/97 of 7 July 1997 on speeding up and clarifying the implementation of the excessive deficit procedure. Official Journal of the European Communities, 2.8.97 L 209/6.
EU, 1997c. Resolution of the European Council on the Stability and Growth Pact. Amsterdam, 17 June 1997. Official Journal of the European Communities, 2.8.97 C 236/1.
EU, 2005. Draft Council Conclusions on the Revised Code of Conduct Relating to the Stability and Growth Pact. 3 October 2005. 12822/05. Brussels.
EU, 2008. A European Economic Recovery Plan. Communication from the Commission to the European Council. 26.11.2008. COM(2008) 800 final. Brussels.
EU, 2009. Press Release 2967th Council meeting Economic and Financial Affairs. 20 October 2009. 14601/09 (Presse 294). Luxembourg.
Frankel, J. and Schreger, J., 2013. Over-optimistic official forecasts and fiscal rules in the eurozone. Review of World Economics, 149(2), pp. 247-272 [ CrossRef]
Fujiwara, I. and Waki, Y., 2020. Fiscal forward guidance: A case for selective transparency. Journal of Monetary Economics, 116, pp. 236-248 [ CrossRef]
Gulen, H. and Ion, M., 2016. Policy uncertainty and corporate investment. Review of Financial Studies, 29(3), pp. 523.564.
Hollyer, J. R., Rosendorff, B. P. and Vreeland, J. R., 2011. Democracy and transparency. Journal of Politics, 73(4), pp. 1191-1205 [ CrossRef]
Hollyer, J. R., Rosendorff, B. P. and Vreeland, J. R., 2014. Measuring Transparency. Political Analysis, 22, pp. 413-434 [ CrossRef]
Hood, C. and Heald, D. (eds.), 2006. Transparency : The Key to Better Governance? Oxford, U.K.: Oxford University Press for The British Academy.
IMF, 1998. Code of Good Practices on Fiscal Transparency - Declaration on Principles. Washington: International Monetary Fund.
Jensen, M. C. and Meckling, W. H., 1976. Theory of the firm: Managerial behavior, agency costs, and ownership structure. Journal of Financial Economics, 3(4), pp. 305-360 [ CrossRef]
Khagram, S., de Renzio, P. and Fung, A., 2013. Overview and synthesis: The political economy of fiscal transparency, participation, and accountability around the world. In: S. Khagram, A. Fung and P. de Renzio, eds. Open Budgets: The Political Economy of Transparency, Participation, and Accountability. Brookings Institution Press, p. 275.
Laffont, J.-J. and Tirole, J., 1992. Should governments commit? European Economic Review, 36, pp. 345-353 [ CrossRef]
Merola, R. and Pérez, J. J., 2013. Fiscal forecast errors: Governments versus independent agencies? European Journal of Political Economy, 32, pp. 285-299 [ CrossRef]
Milesi-Ferretti, G. M., 2004. Good, bad or ugly? On the effects of fiscal rules with creative accounting. Journal of Public Economics, 88(1-2), pp. 377-394 [ CrossRef]
Mosley, L., Paniagua, V. and Wibbels, E., 2020. Moving markets? Government bond investors and microeconomic policy changes. Economics & Politics, 32(2), pp. 197-249 [ CrossRef]
OECD, 2002. OECD Best Practices for Budget Transparency. OECD Journal on Budgeting, 1(3), pp. 7-14 [ CrossRef]
Paredes, J., Pérez, J. J. and Perez-Quiros, G., 2015. Fiscal targets. A guide to forecasters? E uropean Central Bank Working Paper Series, No 1834 [ CrossRef]
Pástor, L. and Veronesi, P., 2012. Uncertainty about Government Policy and Stock Prices. T he Journal of Finance, 67(4), pp. 1219-1264 [ CrossRef]
Pollitt, C. and Hupe, P., 2011. Talking About Government : The role of magic concepts. Public Management Review, 13(5), pp. 641-658 [ CrossRef]
Ríos, A. M., Bastida, F. and Benito, B., 2016. Budget Transparency and Legislative Budgetary Oversight: An International Approach. American Review of Public Administration, 46(5), pp. 546.568 [ CrossRef]
Savage, J. D., 2005. Making the EMU : The Politics of Budgetary Surveillance and the Enforcement of Maastricht. Oxford: Oxford University Press.
Wang, R., Irwin, T. and Murara, L., 2015. Trends in Fiscal Transparency: Evidence from a New Database of the Coverage of Fiscal Reporting. IMF Working Paper, WP/15/188 [ CrossRef]
Wehner, J. and de Renzio, P., 2013. Citizens, legislators, and executive disclosure: The political determinants of fiscal transparency. World Development, 41(1), pp. 96-108 [ CrossRef]
Williams, A., 2015. A global index of information transparency and accountability. Journal of Comparative Economics, 43(3), pp. 804-824 [ CrossRef]
World Bank, 1992. Governance and Development. Washington, D.C.: The World Bank.
|


