5968
Views
1209
Downloads |
Public policy reforms and their impact on productivity, investment and employment: new evidence from OECD and non-OECD countries
Balázs Égert* 
 Balázs Égert
Affiliation:
Balázs Égert
Affiliation: OECD Economics Department, Paris, France; CESifo Munich Poschingerstrasse 5, Muenchen, Germany; EconomiX at the University of Paris X Nanterre, Nanterre, France
 0000-0002-9540-4205
Correspondence
Balazs.Egert@oecd.org 0000-0002-9540-4205
Correspondence
Balazs.Egert@oecd.org
Article | Year: 2022 | Pages: 179 - 205 | Volume: 46 | Issue: 2 Received: June 1, 2021 | Accepted: February 7, 2022 | Published online: June 1, 2022
|

FULL ARTICLE
FIGURES & DATA
REFERENCES
CROSSMARK POLICY
METRICS
LICENCING
PDF
|
|
Source
|
Country coverage
|
Time coverage
|
|
Product market regulation
|
|
Overall
|
OECD Product market regulation Indicators database
|
Around 60
|
Every five years, only one observation for about 15 countries
|
|
Barriers to entry
|
|
Barriers to trade & investment
|
|
Scope of state control
|
|
General business sector regulation
|
|
Business regulation
|
Fraser Institute
|
More than 100 countries
|
Annual, about 10 years
|
|
Cost of contract enforcement
|
World Bank Doing Business Indicators
|
More than 100 countries
|
Annual, about 10 years
|
|
Time of contract enforcement
|
|
Cost of insolvency procedures
|
|
Time of insolvency procedures
|
|
Cost of starting a business
|
|
Time of starting a business
|
|
Labour market regulation
|
|
EPL regular contracts
|
OECD
|
Around 60 countries, 10 countries different than for PMR
|
Annual, 30 years, only one observation for about 15 countries
|
|
Labour market regulation
|
Fraser Institute
|
More than 100 countries
|
Annual, about 10 years
|
|
EPL regular contracts
|
Cambridge
|
117 countries
|
Annual, 40 years
|
|
Institutions
|
|
Legal system
|
Fraser Institute
|
Around 100 countries
|
Annual, about 10 years
|
|
Legal system – enforcement
|
|
Legal system – judicial independence
|
|
Rule of law
|
WB's World Governance Indicators
|
Around 100 countries
|
|
|
Political stability
|
|
|
Corruption
|
|
|
Government effectiveness
|
|
|
Financial development
|
|
Financial liberalisation – EFW
|
Fraser Institute
|
Around 100 countries
|
Annual, until 2005
|
|
Domestic credit % GDP
|
World Bank's World Development Indicators database
|
Around 100 countries
|
Annual, about 30 years
|
|
Domestic private credit % GDP
|
|
Bank branches per capita
|
|
Stock market capitalisation % GDP
|
|
Stock market turnover % GDP
|
|
Trade openness
|
|
Openness
|
World Bank's World Development Indicators database
|
Around 100 countries
|
Annual, about 30 years
|
|
Log openness
|
|
Log openness – size adjusted
|
Own calculation based on WDI
|
|
Trade liberalisation – EFW
|
Fraser Institute
|
Around 100 countries
|
Annual, until 2005
|
|
Innovation intensity
|
|
R&D spending % GDP
|
World Bank's World Development Indicators database
|
Around 100 countries
|
Annual, about 30 years
|
|
Patents/capita
|
Note: LCAP, on the vertical axis, denotes log per capita income (USD, constant PPP). On the horizontal axes are displayed the policies and institutions. For the rule of law, corruption and government effectiveness, higher numbers show a stronger rule of law, less corruption and a more effective government. START_COST, CONTRACT_COST and INSOLV_COST refer to the cost of starting a business, the time required for contract enforcement and insolvency procedures. REG_BUS and REG_LM_EFW are the EFW’s business regulation and labour market regulation indicators: higher values indicate more business-friendly regulation. EPL_CBR is the Cambridge Labour Regulation Indicator relating to regular contract: higher numbers indicate more stringent regulation.Source: Author.
Note: A_LCAP, on the vertical axis, denotes log per capita income (USD, constant PPP, country averages). On the horizontal axes are displayed the policies and institutions. For the rule of law, corruption and government effectiveness, higher numbers show a stronger rule of low, less corruption and a more effective government. For the OECD’s PMR indicator, its sub-components and the OECD and Cambridge EPL indicators, higher figures reflect more stringent regulation. For the EFW’s labour market regulation indicator, higher values indicate less stringent regulation. Source: Author
|
|
MFP
|
Capital deepening
|
Employment rate
|
Per capita income
|
|
Linear relationships
|
|
|
|
|
|
Within dimension
|
|
|
|
|
|
Institutions
|
Yes
|
No
|
Yes
|
Yes
|
|
Business regulation
|
Yes
|
No
|
No
|
No
|
|
Product market regulation
|
–
|
–
|
–
|
–
|
|
Labour market regulation
|
–
|
Yes
|
Yes
|
–
|
|
Financial system development
|
Yes
|
No
|
–
|
Yes
|
|
Between dimension
|
|
|
|
|
|
Institutions
|
Yes
|
No
|
Yes
|
Yes
|
|
Business regulation
|
?
|
No
|
No
|
No
|
|
Product market regulation
|
BTI
|
BTE, SSC
|
BTE, SSC
|
BTI
|
|
Labour market regulation
|
Yes??
|
No
|
Yes??
|
No
|
|
Financial system development
|
Yes
|
Yes
|
–
|
Yes
|
|
Non-linear relationships
|
conditional on
|
|
|
per capita income
|
|
Business regulation
|
Yes
|
No
|
Yes
|
Yes
|
|
Product market regulation
|
BTE,BTI,SSC
|
NO
|
BTE, SSC
|
BTE,BTI,SSC
|
|
Labour market regulation
|
No
|
No
|
Yes
|
No
|
|
|
institutions
|
|
Business regulation
|
Yes
|
No
|
Yes
|
Yes
|
|
Product market regulation
|
BTE,BTI,SSC
|
BTE, SSC
|
BTE, SSC
|
BTE,BTI,SSC
|
|
Labour market regulation
|
No
|
No
|
Yes
|
No
|
|
|
labour market regulations
|
|
Business regulation
|
No
|
No
|
No
|
No
|
|
Product market regulation
|
BTE,BTI,SSC
|
NO
|
BTE,SSC
|
BTE,BTI,SSC
|
|
Labour market regulation
|
No
|
No
|
No
|
No
|
Note: The ratio displayed above is the ratio between the standard deviation calculated on crosssection observations (averages for individual countries, the pure between effect) and the standard deviation of the series stripped of country means and common time trends (pure within effect). Source: Author’s calculations.
|
|
Impact through
|
Total impact
|
|
|
MFP
|
K/Y
|
L
|
Per capita income: aggregated from MFP,
K/Y and L
|
|
|
Policy measured as one standard
deviation
|
|
|
Within
|
Between
|
Within
|
Between
|
Within
|
Between
|
Within
|
Between
|
|
Institutions
|
|
Government effectiveness
|
7.4
|
50.0
|
|
|
0.8
|
5.2
|
8.2
|
55.2
|
|
Rule of law
|
5.0
|
42.9
|
|
|
0.5
|
4.5
|
5.5
|
47.4
|
|
Political stability
|
5.7
|
24.0
|
|
|
1.0
|
4.3
|
6.7
|
28.3
|
|
Corruption
|
5.9
|
39.8
|
|
|
0.9
|
6.0
|
6.8
|
45.8
|
|
Business regulation
|
|
Cost of starting a business
|
0.8
|
1.3
|
9.0
|
15.6
|
|
|
9.8
|
16.9
|
|
Cost of contract enforcement
|
1.4
|
13.5
|
|
|
|
|
1.4
|
13.5
|
|
Time of insolvency procedures
|
5.6
|
14.6
|
|
|
1.1
|
2.8
|
6.6
|
17.4
|
|
Product market regulation
|
|
PMR – overall
|
–
|
|
–
|
8.9
|
–
|
1.5
|
–
|
10.4
|
|
PMR – barriers to entry
|
–
|
17.3
|
–
|
5.2
|
–
|
2.0
|
–
|
24.5
|
|
PMR – barriers to trade & investment
|
–
|
8.3
|
–
|
|
–
|
|
–
|
8.3
|
|
PMR – scope of state control
|
–
|
|
–
|
6.4
|
–
|
4.1
|
–
|
10.5
|
|
Labour market regulation
|
|
EPL – OECD regular contracts
|
|
|
|
|
|
0.9
|
|
0.9
|
|
EPL – Cambridge indicator
|
|
|
|
|
0.8
|
3.1
|
0.8
|
3.1
|
|
Labour market regulation (EFW)
|
|
|
2.1
|
5.5
|
0.8
|
2.0
|
2.9
|
7.5
|
|
Financial development
|
|
Banking sector
|
4.9
|
12.4
|
4.2
|
10.7
|
|
|
9.1
|
23.0
|
|
Financial markets
|
8.1
|
17.2
|
|
|
|
|
8.1
|
17.2
|
Note: MFP, K/Y and L indicate by how much per capita income would increase due to policy changes affecting the three supply-side channels. The change in the indicators is defined as one standard deviation in the data. Columns named ‘within’ show that the change in the policies are based on the within dimension (variation over time). Columns named ‘between’ show that the changes in the policies are obtained from the between (cross-section) dimension. The effects are calculated following the methodology set out in box 1 in Égert and Gal (2016). Empty cells indicate the absence of robust empirical relationships. Cells filled with “--“ indicate that regression analysis was not possible for the particular variable and dimension (PMR indicator over time). The coefficient estimates used to calculate the effect are the average of the minimum and maximum coefficient estimates. Table C11 summarises from which particular regressions the coefficient estimates are used. Source: Author’s calculations.
|
If per
capita income is
|
If rule of
law is
|
If OECD's
EPL on regular contracts is
|
|
Below
|
Above
|
Below
|
Above
|
Below
|
Above
|
|
|
The estimated
threshold
|
The estimated
threshold
|
The estimated
threshold
|
|
Effects on MFP of
|
|
|
|
|
|
|
|
PMR – overall
|
40.4
|
17.4
|
28.2
|
12.6
|
30.4
|
25.3
|
|
PMR – barriers to entry
|
24.5
|
1.5
|
19.4
|
2.8
|
19.4
|
13.0
|
|
PMR – barriers to trade & investment
|
53.1
|
15.8
|
35.5
|
11.0
|
27.7
|
41.0
|
|
PMR – scope of state controll
|
27.1
|
5.3
|
18.1
|
2.8
|
16.9
|
11.0
|
Note: Numbers in bold indicate that the calculations are based on coefficient estimates that were statistically not significant at the conventional level of 10%. Source: Author’s calculations
|
Variables
|
Min
|
Max
|
Mean
|
St. dev.
|
|
Worldwide sample
|
|
Per capita income
|
5.29
|
11.62
|
8.75
|
1.31
|
|
Openness
|
0.31
|
449.99
|
91.94
|
51.78
|
|
Log Openness
|
-1.18
|
6.11
|
4.40
|
0.52
|
|
Log Openness (size adjusted)
|
-4.93
|
1.99
|
0.24
|
0.49
|
|
R&D spending %GDP
|
0.01
|
4.52
|
1.00
|
0.99
|
|
Rule of law
|
-2.67
|
2.00
|
0.00
|
0.99
|
|
Cost of starting a business
|
0.00
|
1,540.00
|
67.00
|
143.00
|
|
Time of starting a business
|
1.00
|
687.00
|
41.00
|
59.00
|
|
Labour market regulation – EFW
|
2.34
|
9.73
|
11475.00
|
1.49
|
|
Business regulation – EFW
|
2.86
|
8.89
|
6.01
|
1.04
|
|
Finance – bank branches per capita
|
0.13
|
237.07
|
19.38
|
23.96
|
|
Stock market capitalisation % GDP
|
0.04
|
606.00
|
54.91
|
62.54
|
|
|
OECD sample
|
|
Openness
|
5.73
|
371.44
|
68.15
|
43.87
|
|
Log Openness
|
1.75
|
5.92
|
4.04
|
0.61
|
|
Log Openness (size adjusted)
|
-2.12
|
1.32
|
0.03
|
0.49
|
|
Business spending on R&D % GDP – OECD
|
0.01
|
3.76
|
1.05
|
0.73
|
|
General spending on R&D % GDP – OECD
|
0.15
|
4.48
|
1.68
|
0.88
|
|
General spending on basic R&D % GDP – OECD
|
0.05
|
0.90
|
0.31
|
0.16
|
|
ETCR – overall
|
0.79
|
6.00
|
4.08
|
1.47
|
|
ETCR – entry barriers
|
0.43
|
6.00
|
3.77
|
1.84
|
|
ETCR – public ownership
|
0.83
|
6.00
|
4.29
|
1.43
|
|
EPL regular contracts
|
0.26
|
5.00
|
2.18
|
0.83
|
|
ALMP spending
|
0.45
|
22.00
|
22.00
|
21.53
|
|
Variables
|
Worldwide sample
|
OECD sample
|
|
|
Min
|
Max
|
Mean
|
St. dev.
|
Min
|
Max
|
Mean
|
St. dev.
|
|
Institutions
|
|
Legal system
|
2.23
|
8.93
|
5.53
|
1.61
|
4.86
|
8.54
|
7,27
|
1,07
|
|
Legal system – enforcement
|
0.00
|
8.11
|
4.46
|
1.75
|
3.22
|
8.11
|
5,75
|
1,29
|
|
Legal system – judicial independence
|
0.60
|
9.15
|
4.80
|
2.15
|
3.85
|
9.17
|
7,06
|
1,74
|
|
Rule of law
|
-2.38
|
1.94
|
0.01
|
0.99
|
-0.53
|
1.94
|
1,27
|
0,60
|
|
Civil liberties
|
1.00
|
7.00
|
4.78
|
1.81
|
4.02
|
7.00
|
6,29
|
0,86
|
|
Polity2 – political stability
|
-10.00
|
10.00
|
3.78
|
6.17
|
27.00
|
10.00
|
8,01
|
3,17
|
|
Corruption
|
-1.71
|
2.45
|
0.01
|
0.98
|
-0.31
|
2.44
|
1,33
|
0,80
|
|
Government effectiveness
|
-2.18
|
2.18
|
0.00
|
0.99
|
0.16
|
2.14
|
1,36
|
0,56
|
|
Business
environment
|
|
Cost of contract enforcement
|
8.00
|
163.00
|
35.00
|
26.00
|
8.00
|
39.00
|
21,00
|
8,00
|
|
Time of contract enforcement
|
133.00
|
1,715.00
|
628.00
|
305.00
|
216.00
|
1,332.00
|
517,00
|
260,00
|
|
Cost of insolvency procedures
|
1
|
76.00
|
17.00
|
12
|
1.00
|
23.00
|
10,00
|
6,00
|
|
Time of insolvency procedures
|
0.40
|
6.97
|
2.75
|
1.21
|
0.40
|
5.84
|
1,92
|
1,16
|
|
Cost of starting a business
|
0.00
|
991.49
|
66.32
|
121.4
|
0.05
|
20.69
|
6,80
|
6,42
|
|
Time of starting a business
|
2.78
|
690.71
|
41.86
|
60.34
|
2.71
|
61.08
|
16,83
|
11,68
|
|
OECD Product Market Regulation Indicator
|
|
PMR – overall
|
|
|
|
|
1.18
|
2.8
|
1,73
|
0,35
|
|
PMR – barriers to entry
|
|
|
|
|
1.49
|
3.07
|
2,06
|
0,37
|
|
PMR – barriers to trade & investment
|
|
|
|
|
0.20
|
2.09
|
0,74
|
0,41
|
|
PMR – scope of state control
|
|
|
|
|
1.51
|
3.92
|
2,41
|
0,54
|
|
|
|
Abstract
This paper evaluates the relationship between public policy reforms and productivity, investment, employment and per capita income for OECD and non-OECD countries. More competition-friendly product market regulations are associated with improved economic outcomes: lower barriers to foreign trade and investment go in tandem with greater multi-factor productivity (MFP), and lower barriers to entry and less pervasive state control over the business sector with larger capital stock and increased employment rate. More flexible labour market regulations are found to go hand in hand with higher employment rates whereas no robust link between labour market regulations and MFP and capital deepening can be established. The findings also suggest that the quality of institutions is fundamental for economic outcomes. Finally, the paper shows that countries at different levels of economic development face different policy effects and that some policy reforms interact with each other by attenuating and amplifying each others’ economic impacts.
Keywords: public policies; structural reforms; product markets; labour markets; regulation; institutions
JEL: D24, E17, E22, E24, J08
1 Introduction
Especially since the 2007/08 financial and economic crises, which truncated economic growth all over the world, structural reforms have been at the forefront of policy discussion. The main policy question centred on the size of the long-run growth dividends of reforms but discussion has also focused on short-term benefits and costs and the political economy of public policy reforms.
There is an abundant body of literature investigating the connection between structural reforms and economic outcomes. It comprises country-, industry- and firm-level analyses, which show that stringent product and labour market regulations are accompanied by weaker productivity outcomes (Andrews and Cingalo,  2014 2014; Nicoletti and Scarpetta, 2003; Cette, Lopez and Mairesse, 2013, 2014). Another strand looks at labour market policies and show that a variety of regulations and labour market institutions are strongly correlated with unemployment and employment outcomes (Blanchard and Wolfers, 2000; Bertola, Blau and Kahn, 2002; Nickell, Nunziata and Ochel, 2005). More specifically, stricter employment protection legislation (EPL), a good proxy for restrictions with regard to hiring and firing, is found to go hand in hand with higher unemployment and lower employment rates (Bassanini and Duval, 2009; De Serres, Hijzen and Murtin, 2014; and Gal and Theising, 2016). The business environment is also an important factor for investment as the costs of starting and running a business will affect business investment (World Bank, 2014). Tight regulation is identified as having a particular effect on investment in network sectors (Alesina et al., 2005; Vartia, 2008; Cambini and Rondo, 2011). There is, however, controversy as to whether labour market regulation is associated with greater or smaller investment (Cingano et al., 2010, 2015; Cette, Lopez and Mairesse, 2016a; Égert, 2016). Finally, the growth literature identifies the quality of institutions as an important driver of long-term economic growth (Acemoglu and Johnson, 2005; Aghion et al., 2016).
Against this background, the purpose of this paper is to estimate the relationship between public policy reforms and economic outcomes, including productivity, capital intensity, employment and long-term per capita income in OECD and non-OECD countries. In doing so, this paper investigates the economic effect of product, labour and financial market regulations, as well as the role of institutions. This study also raises the question of whether policy effects differ for countries at different levels of economic development, whether the quality of institutions and the stance of specific policies generate heterogeneity in the way individual countries react to specific policy changes.
Empirical results reported in this paper suggest that more competition-friendly product market regulations underpin long-term growth. In particular, reducing barriers to foreign trade and investment tend to be related to improved multi-factor productivity (MFP), whereas lowering barriers to entry and cutting back on state interference in the business sector is related to greater capital stock and higher employment rate; cutting the cost of hiring and firing in the labour market goes together with higher employment rates. At the same time, labour market regulations appear to have no strong relationship with MFP and capital deepening. Results also show that countries at different levels of economic development face different policy impacts and that some policy reforms interact with each other by mutual attenuation and amplification. Finally, and very importantly, the quality of institutions appears to have a strong link to improved productivity and per capita income level.
The remainder of the paper is structured as follows. Section 2 discusses data issues. Section 3 describes modelling challenges. Section 4 presents some stylised facts. Section 5 reports on and analyses the results of the assessment. Finally, section 6 demonstrates how the coefficient estimates can be used for reform quantification and shows the impact of policy changes on MFP, capital, employment and per capita income. Section 7 finally provides some concluding remarks.
2 Modelling issues
2.1 Linear models and endogeneity
The quantification of reforms draws on the production function approach, following Barnes et al. (2013), Bouis and Duval (2011), Johansson et al. (2013) and Égert, Gal and Wanner (2017). In such a framework, policy reform effects on GDP can be assessed through their impact on supply-side components including labour productivity and employment, which in turn can be further decomposed into capital intensity and multi-factor productivity, and labour force participation and unemployment, respectively (figure 1). In the empirical estimations, the employment rate is not broken down into the unemployment and participation rates because reduced-form estimation results cannot be always fully reconciled with the findings on the employment rate. The overall impact on GDP per capita is then obtained by aggregating the policy effects of the various channels through a production function.
The linear relationship between policies & institutions and the three supply-side channels: MFP, capital deepening and the employment rate can be modelled as shown in equations (1a to 1c): | MFPj,t = f (OPENj,t, INNOVATIONj,t, PMRj,t, LMRj,t, FMDj,t, INSTITUTIONj,t) | (1a) |
These policies determine how efficiently resources can be reallocated within and across firms and how easy it is to finance new and incumbent businesses. Institutions capture the overall institutional framework (see e.g., Égert, 2016).
Capital deepening can be written as in equation (1b): | (K/Y)j,t = f (UCCj,t, PMRj,t, LMRj,t, FMDj,t, INSTITUTIONj,t) | (1b) |
where UCC denotes the user cost of capital. For reasons of data availability, we use the real interest rate for the large panel (see e.g., Égert, 2018b).
The employment rate equation is given by equation (1c): | Lj,t = f (PMRj,t, LMRj,t) | (1c) |
where LMR denotes a variety of labour market regulations and policies (see e.g., Gal and Theising, 2015). Regressions will be also estimated for per capita income levels. The double objective is to see: (i) whether the variables driving the three supply-side channels can be estimated directly for per capita income levels, and (ii) whether the results obtained for (1a) to (1c) are consistent with overall per capita income equations.
Three types of regressions are used in the empirical analysis in order to fully exploit the dataset. - The first consists of estimating panel regressions including country- and time-fixed effects. The estimated coefficients will reflect how (panel wide) average changes in outcome variables (MFP, capital deepening and employment) correlate with average changes in regulation and institutions.
- The second set of regressions includes variables, which vary over time and a number of variables, which are time invariant and which replace the country fixed effects. The latter will show how cross-country differences in economic outcomes are associated with cross-country differences in policies and institutions.
- Finally, pure cross-country regressions will link outcomes and their covariates using only cross-country differences and no time variation in the data. For this purpose, equations 1(a) to 2(d) are estimated without the time dimension of the data.
The identification of policy effects using macro-level indicators has been criticised in the literature on the grounds that policy effects are not well identified due to aggregation bias and issues related to endogeneity and reverse causality. Against this background, a difference-in-differences approach, making use of industry or firm-level datasets, is often viewed as a panacea for a neater identification of reform effects. Such a set-up links country-level policy indicators to sectoral or firm-level data through an interaction with a variable that captures a different exposure to the regulation analysed. For instance, country-level labour market regulations, such as employment protection legislation, might have a larger effect on industries and firms with larger labour intensity.
Nevertheless, country-level panel estimates have a number of advantages over sector- and firm-level studies. First, sector- and firm level studies typically focus on one policy at a time whereas country-level regressions include a large number of policies. This implies that policy effects are conditional on a number of other policies. Second, and most importantly, country-level regression produces estimates reflecting general equilibrium effects, whereas sector- and firm-level studies provide partial equilibrium results for at least two reasons. First, sector- and firm-level studies use a specific channel (exposure variable), through which the policy reform influences economic outcomes. But other channels might also be at work in practice. As a result, using only one channel leads to partial equilibrium effects. By contrast, macroeconomic estimates provide general equilibrium effects, as they capture all policy channels. Second, sector- and firm-level studies identify the differential policy impact between the least and most exposed sectors/firms. In such a framework, the policy effect is not estimated (or assumed to be zero) for the least exposed sectors/firms. This also leads to partial equilibrium estimates. At the same time, country-level regressions incorporate both the baseline and the differential effects. Endogeneity remains an issue in macroeconomic regressions, in particular in cross-country regressions, and to a lesser extent in cross-country time-series regressions including country and/or time fixed effects. Estimation results should be considered and interpreted with corresponding caution.
2.2 Estimating heterogeneous effects: threshold effects
Threshold models aim to capture non-linear effects that can occur abruptly when the variable of interest has different coefficients below and above a given value of the threshold variable (threshold non-linearity). For instance, the impact of product market regulation could depend on the level of another policy. 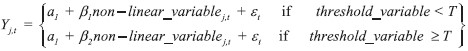 | (2a) |
The threshold value is determined endogenously through a grid search. In this paper, a grid search with steps of 1% of the distribution is carried out to identify the value of the threshold variable that minimises the sum of squared residuals of the estimated two regime model. The grid search starts at 15% of the distribution and stops at 85% to ensure that a sufficient number of observations falls into each regime. There is evidence for non-linearity if the null hypothesis of β1 = β2 can be rejected against the alternative hypothesis of β1 ≠ β2 (Hansen, 1996; 1999). In practice, this test shows whether coefficient estimates are significantly different for different country groups (e.g., emerging vs. developed countries).
One question addressed in this paper is whether various product and labour market policies have the same impact in all countries or whether different countries may face different policy impacts. One obvious source of heterogeneity, which could lead to different policy impacts across groups of countries is the level of development. Per capita income will be used in this paper to measure economic development. Adjusting equation (2a) to per capita income levels as the threshold variable gives equation (2b):  | (2b) |
Another question to be raised is the extent to which institutions matter. Institutions could enter the country-time panel regressions as a time-varying variable. If country fixed effects are included into the regressions, the relationship will be identified through the within dimension, that is through the time variation in these variables. However, institutions tend to change very slowly over time. It would therefore be interesting to investigate the extent to which the cross-country variation in institutions is correlated with cross-country differences in economic outcomes. One way to look at this issue is to replace country fixed effects with constants capturing institutions. In such a setting, institutions would be measured as their period averages. Obviously, such an approach runs the risk of an omitted variables bias. But if the overall fit (adjusted R-squared) of the regressions excluding country-fixed effects and including institutional constants comes close to that of regressions including country-fixed effects, such a bias is possibly small.
Institutions may matter for economic outcomes not only in their own right but also through the way they influence the impact of other policies. For instance, better institutions could increase the negative impact of more restrictive regulations via better enforcement. Better quality institutions could also decrease the negative impact of more binding regulations via reducing regulatory uncertainty. This hypothesis could be tested as follows:
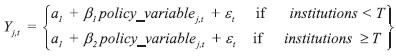 | (2c) |
Threshold regressions are well suited to provide insights for the last question posed by this paper: do different policies interact with each other? More specifically, we would be interested to figure out whether the level of labour market policies amplifies or attenuates the effect of product market regulations on output levels and vice versa. Equation (2d) will be employed to test for this hypothesis:  | (2d) |
where T is the threshold value of labour market regulations.
3 Data issues
The major challenge is related to data availability.1 The main OECD indicators of regulation are either not available for non-OECD emerging market economies or they are available only for a very recent period (usually as one single observation), making their use impossible for regression analysis drawing on the time series dimension of the data (panels including country and time fixed effects). There are, however, two possible remedies for this problem. First, using the cross-section dimension of the variables offers only one or two observations per country. Two OECD indicators have been recently expanded to cover non-OECD countries: (i) the overall Product Market Regulation (PMR) indicator and its sub-components are available for more than 60 countries. For the countries recently added to the database, only one observation is available for a recent period (usually 2013 or 2014). (ii) the employment protection legislation (EPL) indicator has also become available for additional countries. A similar number of countries are covered by PMR and EPL but they do not cover exactly the same countries (table 1). Second, finding alternative indicators covering more countries is an option. Measures of product and labour market regulations from non-OECD databases could be potentially used to investigate policy impacts for a larger set of countries. Three major datasets could be of use here: - The World Bank’s Doing Business indicators. They cover the cost and time of starting a business, insolvency procedures and contract enforcement.
- The Fraser Institute’s Economic Freedom of the World (EFW) database, which offers a measure of business regulation and a measure of labour market regulation (each broken down into six sub-categories). The headline business and labour market regulation indicators are used in the following regression analysis.2
- The very comprehensive dataset of the Cambridge Labour Regulation Indicator (CBR LRI) annually covers labour market-related legal regulations in 117 countries over more than 40 years (Adams, Bishop and Deakin, 2016). The dataset includes 40 categories of labour market regulations. For the purpose of quantification, the six categories concerning regular contracts are considered. Their simple arithmetic average is used as an alternative to the OECD’s EPL indicator (for regular contacts).
One question that begs for answer in this context is the extent to which OECD indicators are related to the above listed alternative measures of product and labour market regulation. A comparison can be done in the cross section (using country averages over 2002 to 2012) as the OECD’s PMR and EPL indicators will be used to explain cross-country variation and not variation over time (due to data availability). Cross-section correlation shows that the correlation coefficient between the OECD’s EPL and the EFW’s labour market regulation indicator is around 0.7. The same figure is slightly higher than 0.6 for OECD EPL and Cambridge EPL. Correlation is weaker between the OECD’s PMR indicator and the alternative measures. The figure is about 0.5 for the EFW business regulation indicator and ranges from 0.1 to 0.5 for the various Doing Business indicators.
Table 1Overview of indicators used in the regression analysis by main policy and outcome areas DISPLAY Table
The dataset used for the empirical analysis is obtained from the OECD’s Structural Policy Database for Economic Research (SPIDER) database, which contains four main types of indicators: (i) legal and political institutions; (ii) framework conditions and regulations that determine the overall business environment in which businesses operate. They determine for instance how costly it is to start, run and close a business and reallocate resources within and across firms; (iii) very specific regulations and intermediate outcomes. They cover policies and regulations affecting only a specific segment of a supply-side channel such as elderly or female workers. Examples are family benefits or policies aimed at influencing the effective retirement age. The frontier between framework conditions and very specific policies is not always very clear cut. (iv) Outcome variables. These cover variables that are influenced by institutions and policies such as per capita income, various measures of productivity, investment, employment, unemployment and the participation rate. 3
Based on SPIDER, two panels are considered: - The first and smaller panel covers countries for which the OECD’s PMR and EPL indicators are available. This means a total of around 60 countries.
- The second and larger panel comprises more than 100 countries (including countries of the first panel)4. The time coverage of this dataset goes from 2002 to 2012. The data coverage is largely dictated by data availability of the regulation indicators and to a lesser extent the institutional indicators. The Doing Business indicators covering the cost and time of starting a business, contract enforcement and insolvency procedures have a time-series of about 10 years. The same applies to the business and labour market regulation indicators by Economic Freedom of the World (EFW). In an attempt to reduce noise in the data, countries with a population less than one million people are excluded.
There are variables for which only one data point is available for a number of countries (the OECD’s PMR and EPL indicators). Second, the variables coming from alternative sources are annual series but they tend to cover only 10 years (Doing Business indicators, the Fraser Institute’s regulation indicators). This period is considerably shorter than the time span of about 30 years of the OECD indicators. There are two avenues to dealing with this situation: - For the OECD’s PMR and EPL indicators, we estimate models in which the cross-section dimension of such data is exploited. These variables will be used either as constants in cross-country/time panels or as covariates in cross-section regressions.
- For variables available for roughly 10 years, panel regressions will be used. Nevertheless, these variables have more cross-country variation than changes over time. Hence, period averages for these variables will be also calculated and used as constants in panel regressions or as variables in cross-section regressions (annex A provides descriptive statistics for the variables used in the empirical analysis).
Using some of the regulatory indicators needs to be taken with a pinch of salt because de jure policy indicators developed by the OECD, the World Bank and other institutions might not fully correspond to de facto policies, especially in emerging market economies and developing countries. Another reason for caution is the fact that informality, widespread in less developed countries, is not captured by our outcome variables, especially for the employment rate but also for multi-factor productivity and the capital stock.
4 Stylised facts
This section gives some stylised facts on economic outcomes, regulations and institutions for a large set of advanced, emerging and developing countries. Scatterplots suggest that better institutions and competition-friendly product market regulations correlate with better economic outcomes, in particular with higher MFP levels. At the same time, it is difficult to see a firm and clear pattern between outcomes and labour market regulation.
Some strong and some very weak (or non-existent) relationships can be read from figures 2 and 3. Starting with the strong relationships, better institutions (measured by the rule of law, corruption or government effectiveness) are clearly associated with higher per capita income levels. This relationship, confirmed by annual and cross-section data (figures 1 and 2), is unlikely to be monotonic. Looking at the three supply side channels, the data reveal a similarly positive link to institutions in the case of MFP (see figure A1 in annex A in Égert, 2018a), but much less so for the capital stock and employment rates.
Turning to product market and general business regulations, the simple correlations with economic outcomes provide a somewhat less clear-cut picture. Using cross-section data for the OECD’s PMR indicator and its sub-components suggests that more stringent regulations are associated with lower per capita income levels (figure 2). This pattern is clearly present for MFP and, to a lesser extent, for the employment rate, but not for the capital stock (see figure A3 in annex A in Égert, 2018a). Alternative indicators capturing the ease of starting and operating a business (World Bank’s Doing Business and the Fraser Institute’s EFW business regulation) show signs of a positive correlation with per capita income levels (figure 2). Again, this relation reflects a similar correlation between different indicators of regulations and MFP whereas there is no apparent correlation with the capital stock and employment (see figure A2 in annex A in Égert, 2018a).
A look at labour market regulations suggests that there is no straightforward correlation between labour market regulations and per capita income levels. At most, only a weak negative link between the OECD’s EPL indicator and outcomes can be detected (especially with per capita income and MFP). 5
Figure 1Stylised facts – per capita income, regulation and institutions, annual data DISPLAY Figure
Figure 2Stylised facts – per capita income, regulation and institutions, cross-section data (country averages) DISPLAY Figure
5 Estimation results
5.1 Linear regressions
5.1.1 Institutions
The quality of institutions matters to a large extent both over time and across countries. Improvements in institutional quality (government effectiveness and political stability) relate to better economic outcomes. Countries with better institutions have superior economic outcomes. These results hold for MFP and the employment rate and for all measures of institutions (tables B2 to B4 and tables B8 to B10 in annex B in Égert, 2018a). Yet, there is no empirical evidence that better institutions are associated with a greater capital stock (tables B5 to B7 in annex B in Égert, 2018a).7 A very strong direct aggregate impact of institutions on per capita income can also be identified in growth regressions (tables B10 to B12 in annex B in Égert, 2018a).
5.1.2 Product market regulations
Regarding the OECD’s PMR indicator, results suggest that greater barriers to trade and investment are linked to weaker MFP. By contrast, no significant effect can be identified for barriers to entry and there is positive correlation between state control and MFP. Regressions carried out for labour productivity (GDP per employee) and per capita income are in accordance with the results found for MFP: a negative relationship to barriers to trade and investment and a positive one to state control. This latter result needs further analysis.
The PMR indicator exhibits a negative link to capital deepening and the employment rate. A robust finding is that more direct state involvement in business sector activities are connected with a lower employment rate (tables B9 and B10 in annex B in Égert, 2018a). There is also some evidence that higher barriers to entry are related to lower capital stock and employment rate. But this finding does not hold for all alternative specifications (tables B6, B9 and B10 in annex B in Égert, 2018a).
5.1.3 Business regulations
The stance of general business sector regulation8 and the extent to which it undermines competition is an important driver of MFP levels. A more competition-friendly stance of the Fraser Institute’s business regulation indicator is associated with higher MFP in cross-country/time series panels (table B2 in annex B in Égert, 2018a). Cross-section regressions confirm this result for the large sample (table B4 in annex B in Égert, 2018a). A similar but less robust relationship could be identified for the employment rate. Capital deepening does not appear to have a link with this particular indicator of business sector regulation.
Doing Business indicators have a similar impact. For instance, higher costs of setting-up a business are associated with lower MFP levels (table B2 in annex B in Égert, 2018a). Increased costs of contract enforcement and longer times required for insolvency procedures also go hand in hand with lower MPF in both pooled and cross-country regressions (table B3 and B4 in annex B in Égert, 2018a). The connection between business regulation and capital deepening is less robust. Yet there is some evidence that higher costs of contract enforcement are associated with lower capital stock (table B7 in annex B in Égert, 2018a).
5.1.4 Labour market regulations
Estimation results show a very weak link between labour market regulation and MFP. In cross-country regressions, the OECD’s EPL indicator is statistically not significant. The two alternative indicators, the Cambridge EPL and the EFW labour market regulation index either turn out not to be related to MFP or indicate that more stringent regulation is associated with better MPF outcomes. Results indicate that tightening labour market regulations reduces capital deepening. Nevertheless, no such relationship can be established for the cross-section dimension.9
Findings are slightly more encouraging for the employment rate: a tightening of labour market regulations is associated with a decrease in the employment rate (EFW’s labour market regulation indicator). In the cross-section dimension, stricter labour market regulation goes hand in hand with lower employment rates for the EFW’s indicator and the Cambridge EPL indicator. The OECD’s EPL indicator does not seem to have a statistically significant relationship with the employment rate (tables B8 to B10 in annex B in Égert, 2018a). For per capita income, results do not support the view that more costly hiring procedures reduce the employment rate (tables B11 to B13 in annex B in Égert, 2018a). This could be because the various measures of EPL on regular contracts may not be a pure measure of firms’ constraints on employment. First, de jure EPL indicators for regular contracts may be far from how EPL is applied in practice ( de facto). Second, other components of labour market regulations may be more binding.
5.1.5 Financial development and other controls
Financial sector development is an important factor of MFP. A more developed financial sector and to some extent a deeper capital market are found to boost MFP. Financial sector development is also crucial for capital deepening. This result is strongly supported for the overall per capita income regressions (tables B11 to B13 in annex B in Égert, 2018a).
Regarding the other controls, human capital tends to have a positive relation with MFP, mostly when used to explain cross-country variation in MFP. By contrast, it is very difficult to establish robust relationships between the various measures of innovation intensity (R&D spending as a share of GDP and patent per capita) and alternative measures of trade openness (adjusted or not for country size, taken in level or in log level) on the one hand, and MFP on the other hand. Experimenting with country and time coverage shows that results are sensitive to data coverage. In particular, longer time series are required to identify a positive link between innovation, openness and MFP (table B1 in annex B in Égert, 2018a).
5.2 Heterogeneity
The following sub-sections give details on possible heterogeneous effects conditional on the level of economic development, the strength of institutions and the stance of other regulations and policies.10,11
5.2.1 The effect of economic development
Countries at different level of economic development face different policy impacts. Threshold regressions show that product market regulations are more binding for countries with lower per capita income levels. More specifically, stringent product market regulations will have a three time larger negative relation to MFP in coun-tries with per capita income lower than about 8,000 USD (in PPP terms).12 These effects also hold true for barriers to entry, barriers to trade and investment and the scope of state control. A very similar pattern can be observed for Doing Business indicators even though the estimated thresholds can vary between about 3,000 to 9,000 USD for the cost of contract enforcement, the time of insolvency procedures and the time of starting a business (tables C1 and C2 in annex C in Égert, 2018a).
An opposite set of patterns emerge for the employment rate: negative policy effects tend to be higher for more developed countries. To start with cross-country regressions, negative PMR effects are larger for countries having per capita incomes above 6,000 USD. Such threshold effects can be identified for barriers to entry and for the scope of state control (but not for barriers to trade and investment) (tables C5 and C6 in annex C in Égert, 2018a).
Non-linear relationships can be established along the within (time series) dimension for labour market indicators. The Cambridge EPL indicator has an estimated negative sign for per capita income levels exceeding around 6,000 USD. The Fraser Institute’s labour market regulation indicator shows that more regulation will be associated with lower employment if per capita income exceeds approximately 12,000 USD. 13
Policy effects on the capital stock are found not to be conditional on per capita income levels.
At the aggregate level, non-linear effects obtained for MFP dominate non-linear effects on the employment rate: threshold regressions run for per capita income are in line with those for MFP. Larger negative effects of PMR and doing business indicators can be observed for less developed countries, when using both the PMR indicator and the World Bank’s Doing Business indicators. The regime switches are also estimated to happen around very similar tipping points (tables C7 and C8 in annex C in Égert, 2018a).
5.2.2 The effect of institutions on other policies
The quality of institutions has a strong impact on how policies correlate with outcomes. Regarding MFP, weaker institutions are associated with a substantially larger negative effect of overall product market regulation. The negative correlation between MFP and higher barriers to entry, trade and investment and more state involvement is more significant if the quality of institutions is low (table C1 in annex C in Égert, 2018a). Similarly, Doing Business indicators, in particular longer insolvency procedures, have disproportionally larger coefficient estimates if the rule of law is weak. Employment and capital stock also have a non-linear relationship to product market regulations conditional on the quality of institutions. In contrast to MFP, the negative link between regulations on the one hand and investment and employment on the other are larger if institutions are stronger. For instance, if institutions are stronger, more stringent labour market regulations (Cambridge EPL) have a more negative relationship with employment (tables C4 to C6 in annex C in Égert, 2018a). Again, the negative association between PMR and MFP seem to outweigh the negative link to capital deepening and employment. Threshold regressions for per capita income produce very similar regimes as for MFP: a larger negative coefficient estimate of regulations at lower levels of institutions. The threshold value that separates the two regimes (the value of institutions below and above which the impact of regulations is different) is also very similar (tables C7 and C8 in annex C in Égert, 2018a).
5.2.3 The interaction between product and labour market policies
Estimation results strongly suggest that PMR effects are conditional on the level of labour market regulations for MFP and the employment rate. A surprisingly robust result for MFP, holding for all three alternative measure of labour market regulation is that the negative PMR coefficient becomes more negative if labour market regulation is looser (table C9 in annex C in Égert, 2018a).
Table 2Summary of estimation results DISPLAY Table
6 Quantifying policy reforms
6.1 Measuring reforms
Reform effects are analysed in two different ways. First, a one standard deviation in the time series purged of country and year fixed effects captures past average reforms. Second, a one standard deviation of the cross-country differences can be used to demonstrate the potential for future reforms. Cross-country variation in the data is substantially larger than the average variation over time. Figure 3 below shows that the difference can be very large. For instance, the cross-country (between) variation of the rule of law variable is about nine time higher than the (within) variation over time. The ratio averages around 5 for other institutional variables and the OECD’s PMR and EPL indicators.
Figure 3The ratio of standard deviation of the pure cross-section to standard deviation over time DISPLAY Figure
Most of the earlier literature aimed at quantifying structural reforms carried out regression analysis for a panel of OECD countries. In such regressions, country and time fixed effects are employed. The consequence of this estimation strategy is that coefficient estimates reflect average correlations over time for the countries included in the panel. Yet these estimates were often used to show what would happen if a poorly performing country aligned its policies with good-practice countries (Barnes et al., 2013; Bouis and Duval, 2011; Cette, Lopez and Mairesse, 2016a, 2016b). This is problematic. Indeed, this practice is tantamount to applying inference identified over the time series (within) dimension to cross-section data. We saw that the cross-country variation of most policy variables is substantially larger than the within variation.
The approach presented here offers a remedy in the calculations for countries that wish to adjust their policies and regulation to “cutting edge” countries. Our coefficient estimates are partly obtained on the basis of cross-sectional data. They can hence be safely applied to simulate policy impacts due to cross-country differences.
6.2 Quantification of reforms
6.2.1 Linear regressions
Quantification results show a number of striking features. First, as flagged earlier, the cross-country (between) variation in the data is larger than that over time (within). The quantification results reflect this observation. Second, better institutions are associated with considerably higher per capita income. When cross-country differences are taken into account, reforms in institutions, captured by one standard deviation, are linked with per capita income by up to 50%. This effect is channelled through MFP and to a much lesser extent by the employment rate. Capital deepening does not play a role. The overall aggregate effects are very comparable whether from adding up the three supply-side channels or whether they are derived directly from per capita income regressions (table 3a). Yet as noted earlier, large cross-country variations, such as observed in institutional quality are very likely to disappear even in the medium to long run, and hence these effects should be considered as potential effects.
It should be noted that not all of the policy effects reported in table 3a can be summed up. For instance, the results for institutions are obtained from separate equations. So the results should be taken separately. A change in the rule of law and corruption cannot be added up, because they are highly correlated with one another. The same applies to the overall PMR indicator and its sub-components. Business regulation and product market regulations go in tandem with substantial economic improvements: a one standard deviation cross-country improvement is associated with 20% higher per capita income. These effects transit through all three supply-side channels. Financial sector development is associated with higher per capita income. Both more developed banking sectors and deeper financial markets are correlated with improved economic outcomes, mostly through a boost to MFP. Labour market regulations are found to be linked to capital deepening and the employment rate. The magnitude of these relationships is, however, much smaller than those generated by institutional reform and more competition-friendly business and product market regulations.
Overall, direct estimates on per capita income deliver results consistent with those aggregated up from MFP, capital deepening and the employment rate. However, some caution is of order here. To start with, some of the policy effects cannot be detected in per capita income regressions. In such cases, no direct comparison is possible and this also validates the use of the disaggregated supply-side channels. Another observation is that in some instances, direct and indirect per capita income effects can differ. In the matter of the cost of starting a business and in that of banking sector development, the direct effects are considerably lower.
Table 3b below demonstrates the non-linear relationship between the OECD’s PMR indicator and its sub-components and MFP. Large positive effects are established for all components if per capita income is lower than about 8,000 USD and if the rule of law is weak. Effects in the high per capita income and the strong rule of law regimes are economically large for barriers to trade and investment. At the same time, barriers to entry and state control have a small influence on MFP in the same regimes.
Table 3AQuantification results – linear regressions, per capita effects due to the three supply-side channels (in percent) DISPLAY Table Table 3BQuantification – non-linear regressions (in percent) DISPLAY Table
7 Concluding remarks
This paper has quantified the long-term relationships between pro-market product, labour and financial market regulation reforms on the one hand and country-level economic outcomes on the other hand for a panel including OECD and non-OECD countries. The findings show that reforming product, labour and financial market regulations is associated with substantial benefits, though the magnitude of the relationship between labour market deregulation and per capita income is considerably lower compared with those generated by improving product and financial market regulations. The quantification results reveal that improved institutions are associated with massively better economic outcomes, in particular in multi-factor productivity, and this effect is considerably larger than the positive link of outcomes and a range of other regulations, even though caution is needed here as improving the quality of institutions is a particularly hard job and is fraught with a great deal of historical inertia. Results also indicate large differences across developed and developing countries with the growth benefits being larger in less developed countries. These results can potentially be very helpful to policymakers for the evaluation of the economic impact of past reforms or to get a broad idea about the link between planned and future public policy reforms and economic outcomes.
Annex
Descriptive statisticsTable A1Descriptive statistics: time varying variables DISPLAY Table Table A2Descriptive statistics: time-invariant variables (period averages) DISPLAY Table
Notes
* The views expressed in this paper do not necessarily reflect the views of the OECD or any other institution the authors is affiliated with. The author would like to thank to two anonymous referees for their very useful and constructive comments and suggestions. This paper is a considerably revised version of the paper Égert (2018a).
1 Another challenge, mentioned earlier and difficult to tackle here is the widespread informality and the larger difference between de jure and de facto measures of indicators in less-developed countries.
2 It would be interesting to use the sub-indicators. Nevertheless, they are strongly correlated with each other both along the within (variation over time) and between (cross-country variation) dimensions. Hence, they could not be included in the regressions at the same time.
3 SPIDER is a compilation of data from 43 existing data sources. It draws heavily on a large number of existing OECD databases. It includes a number of non-OECD databases such as the World Bank’s Doing Business and World Development Indicators databases of the Penn World Table 8.0. The final source of data in SPIDER is individual research papers, either academically published articles or working papers (for more details, see Égert, Gal and Wanner, 2017).
4 The full set including countries for which a small combination of variables is available comprises 149 countries. The ISO codes of the countries are given as follows: ago alb are arg arm aus aut aze bdi bel ben bfa bgd bgr bhr bhs bih blz bol bra brb brn bwa caf can che chl chn civ cmr cog col cpv cri cyp cze deu dnk dom dza ecu egy esp est eth fin fji fra gab gbr geo gha gmb gnb grc gtm guy hkg hnd hrv hti hun idn ind irl irn isl isr ita jam jor jpn kaz ken kgz khm kor kwt lbn lka lso ltu lux lva mar mda mdg mex mkd mli mlt mmr mne mng moz mrt mus mwi mys nam ner nga nic nld nor npl nzl omn pak pan per phl png pol prt pry qat rus rwa sau sen sgp sle slv srb sur svk svn swe swz syr tcd tgo tha tjk tto tun tur tza uga ukr ury usa ven vnm yem zaf zmb zwe
5 But the scatterplots shown in figures 2 and 3 and in the annex A reported in Égert (2018a) do not reveal any apparent link between the two other indicators and economic outcomes.
6 Some of the explanatory variables used in the analysis are strongly correlated with each other. To avoid the problem of multi-collinearity in the regressions, the variables are grouped in the regressions so that strongly correlated variables are not used at the same time. The correlation analysis indicates no major problem of correlation for the variables once country and time fixed effects are purged from the data (for the country/time panel regressions). However, there is clearly a problem of correlation for the cross-section dimension. The institutional variables are strongly correlated with one another but also with the OECD’s PME indicator and sub-components, and the EFW business regulation index. The three labour market regulation indicators are also correlated with each other. There is also a strong correlation between various measures of trade openness. The two measures of innovation intensity also exhibit a high correlation coefficient. Furthermore, R&D spending as a % of GDP is correlated with other covariates as well. Against this background, only variables will be included in the same regression, which are not correlated with each other.
7 Further analysis would be needed to confirm this result.
8 Business sector regulation refers to the World Bank’s Doing Business indicators. Product market regulation indicators refer to the OECD’s PMR indicator.
9 It could be argued that more restrictive labour market regulation would lead to a greater capital deepening as businesses would reduce labour intensity. Empirical results are mixed on this effect. Égert (2018b) provides an overview of the empirical literature on this issue and reports results, using country-level data for OECD countries, according to which more stringent labour market regulation reduces capita deepening.
10 For MFP, the non-linear regressions contain the following linear control variables: human capital, openness, innovation intensity (patents per capita) and financial development (banking sector and stock markets). PMR, labour market regulations and institutions were included if these variables were not the non-linear variables in the regressions.
11 Table C10 in annex C in Égert (2018a) provides descriptive statistics of the threshold variables.
12 We also experimented by imposing per capita income threshold of 5,000 and 10,000 USD. Coefficient estimates
are less precisely estimated in these cases (suggesting that it is better to estimate the thresholds rather
than to impose them).
13 Regression were also run to see whether the coefficient estimates on trade openness, innovation intensity and
human capital differ as a function of per capita income levels. Results indicate, especially when only these
three variables are used as explanatory variables, that openness starts to have a positive coefficient if per capita
income is higher than USD 10,000 for time series panel regressions and above USD 6,000 for cross-section
regressions. Similarly, the coefficient estimate on human capital is more positive above comparable thresholds.
No non-linear effect can be identified for innovation intensity.
* The views expressed in this paper do not necessarily reflect the views of the OECD or any other institution the authors is affiliated with. The author would like to thank to two anonymous referees for their very useful and constructive comments and suggestions. This paper is a considerably revised version of the paper Égert (2018a).
1 Another challenge, mentioned earlier and difficult to tackle here is the widespread informality and the larger difference between de jure and de facto measures of indicators in less-developed countries.
2 It would be interesting to use the sub-indicators. Nevertheless, they are strongly correlated with each other both along the within (variation over time) and between (cross-country variation) dimensions. Hence, they could not be included in the regressions at the same time.
3 SPIDER is a compilation of data from 43 existing data sources. It draws heavily on a large number of existing OECD databases. It includes a number of non-OECD databases such as the World Bank’s Doing Business and World Development Indicators databases of the Penn World Table 8.0. The final source of data in SPIDER is individual research papers, either academically published articles or working papers (for more details, see Égert, Gal and Wanner, 2017).
4 The full set including countries for which a small combination of variables is available comprises 149 countries. The ISO codes of the countries are given as follows: ago alb are arg arm aus aut aze bdi bel ben bfa bgd bgr bhr bhs bih blz bol bra brb brn bwa caf can che chl chn civ cmr cog col cpv cri cyp cze deu dnk dom dza ecu egy esp est eth fin fji fra gab gbr geo gha gmb gnb grc gtm guy hkg hnd hrv hti hun idn ind irl irn isl isr ita jam jor jpn kaz ken kgz khm kor kwt lbn lka lso ltu lux lva mar mda mdg mex mkd mli mlt mmr mne mng moz mrt mus mwi mys nam ner nga nic nld nor npl nzl omn pak pan per phl png pol prt pry qat rus rwa sau sen sgp sle slv srb sur svk svn swe swz syr tcd tgo tha tjk tto tun tur tza uga ukr ury usa ven vnm yem zaf zmb zwe
5 But the scatterplots shown in figures 2 and 3 and in the annex A reported in Égert ( 2018a) do not reveal any apparent link between the two other indicators and economic outcomes.
6 Some of the explanatory variables used in the analysis are strongly correlated with each other. To avoid the problem of multi-collinearity in the regressions, the variables are grouped in the regressions so that strongly correlated variables are not used at the same time. The correlation analysis indicates no major problem of correlation for the variables once country and time fixed effects are purged from the data (for the country/time panel regressions). However, there is clearly a problem of correlation for the cross-section dimension. The institutional variables are strongly correlated with one another but also with the OECD’s PME indicator and sub-components, and the EFW business regulation index. The three labour market regulation indicators are also correlated with each other. There is also a strong correlation between various measures of trade openness. The two measures of innovation intensity also exhibit a high correlation coefficient. Furthermore, R&D spending as a % of GDP is correlated with other covariates as well. Against this background, only variables will be included in the same regression, which are not correlated with each other.
7 Further analysis would be needed to confirm this result.
8 Business sector regulation refers to the World Bank’s Doing Business indicators. Product market regulation indicators refer to the OECD’s PMR indicator.
9 It could be argued that more restrictive labour market regulation would lead to a greater capital deepening as businesses would reduce labour intensity. Empirical results are mixed on this effect. Égert (2018b) provides an overview of the empirical literature on this issue and reports results, using country-level data for OECD countries, according to which more stringent labour market regulation reduces capita deepening.
10 For MFP, the non-linear regressions contain the following linear control variables: human capital, openness, innovation intensity (patents per capita) and financial development (banking sector and stock markets). PMR, labour market regulations and institutions were included if these variables were not the non-linear variables in the regressions.
11 Table C10 in annex C in Égert ( 2018a) provides descriptive statistics of the threshold variables.
12 We also experimented by imposing per capita income threshold of 5,000 and 10,000 USD. Coefficient estimates
are less precisely estimated in these cases (suggesting that it is better to estimate the thresholds rather
than to impose them).
13 Regression were also run to see whether the coefficient estimates on trade openness, innovation intensity and
human capital differ as a function of per capita income levels. Results indicate, especially when only these
three variables are used as explanatory variables, that openness starts to have a positive coefficient if per capita
income is higher than USD 10,000 for time series panel regressions and above USD 6,000 for cross-section
regressions. Similarly, the coefficient estimate on human capital is more positive above comparable thresholds.
No non-linear effect can be identified for innovation intensity.
Disclosure statement
There are no conflicts of interest to disclose.
References
Acemoglu, A. and Johnson, S., 2005. Unbundling institutions. Journal of Political Economy, 113(5) [ CrossRef]
Aghion, P. [et al.], 2016. Taxation, corruption and growth. NBER Working Paper, No. 21928 [ CrossRef]
Alesina, A. [et al.], 2005. Regulation and investment. Journal of the European Economic Association, 3(4), pp. 791-825 [ CrossRef]
Andrews, D. and Cingano, F., 2014. Public policy and resource allocation: evidence from firms in OECD countries. Economic Policy, 29(78), pp. 253-296 [ CrossRef]
Barnes, S. [et al.], 2013. The GDP impact of reform: a simple simulation framework. OECD Economics Department Working Papers, No. 834 [ CrossRef]
Bassanini, A. and Duval, R., 2009. Unemployment, Institutions, and Reform Complementarities: Reassessing the Aggregate Evidence for OECD Countries. Oxford Review of Economic Policy, 25, pp. 40-59 [ CrossRef]
Blanchard, O. and Wolfers, J., 2000. The Role of Shocks and Institutions in the Rise of European Unemployment: The Aggregate Evidence. The Economic Journal, 110, C1-C33.
Bouis, R. and Duval, R., 2011. Raising potential growth after the crisis. OECD Economics Department Working Papers, No. 835 [ CrossRef]
Cambini, C. and Rondi, L., 2011. Regulatory independence, investment and political inference: Evidence from the European Union. RSCAC Working Paper, 2011/42.
Cette, G., Lopez, J. and Mairesse, J., 2013. Upstream product market regulations, ICT, R&D and productivity. NBER Working Paper, No. 19488.
Cette, G., Lopez, J. and Mairesse, J., 2014. Product and labour market regulations, production prices, wages and productivity. NBER Working Paper, No. 20563 [ CrossRef]
Cette, G., Lopez, J. and Mairesse, J., 2016a. Market regulations, prices and productivity. American Economic Review, 106(5), pp. 104-108 [ CrossRef]
Cette, G., Lopez, J. and Mairesse, J., 2016b. Labour market regulations and capital intensity. NBER Working Paper, No. 22603 [ CrossRef]
Cingano, F. [et al.], 2010. The effect of employment protection legislation and financial market imperfections on investment: evidence from a firm-level panel of EU countries. Economic Policy, 25(61), pp. 117-163.
Cingano, F. [et al.], 2015. Employment protection legislation, capital investment and access to credit: evidence from Italy. Economic Journal, 126(595), pp. 1798-1822 [ CrossRef]
De Serres, A., Hijzen, A. and Murtin, F., 2014. Unemployment and the Coverage Extension of Collective Wage Agreements. European Economic Review, 71, pp. 52-66 [ CrossRef]
Égert, B., 2018b. Regulation, institutions and aggregate investment: new evidence from OECD countries. Open Economies Review, 29(2), pp. 415-449.
Égert, B., Gal, P. and Wanner, I., 2017. Structural policy indicators database for economic research (SPIDER). OECD Economics Department Working Paper, No. 1429 [ CrossRef]
Gal, P. and Theising, A., 2015. The macroeconomic impact of policies on labour market outcomes in OECD countries: a reassessment. OECD Economics Department Working Paper, No. 1271 [ CrossRef]
Hansen, B. E., 1999. Threshold effects in non-dynamic panels: Estimation, testing, and inference. Journal of Econometrics, 93, pp. 345-368 [ CrossRef]
Johansson, A. [et al.], 2013. Long-term growth scenarios. OECD Economics Department Working Papers, No. 1000 [ CrossRef]
World Bank, 2014. Research on the effects of business regulation. Washington: The World Bank [ CrossRef]
|
|
|
June, 2022
II/2022
|


